Monitoring Argo CD applications
Monitor Argo CD applications individually or within groups in the GitOps Apps dashboard.
This article focuses on monitoring individual Argo CD applications in the GitOps Apps dashboard. To monitor deployments of a group of applications in parallel, see Application Group information.
Monitor deployments, resources, and services of individual applications
As a one-stop shop for Argo Rollouts and Argo CD, the GitApps dashboard and its Applications tab delivers on the challenge of keeping track of your applications and their deployments, whatever the frequency and scale, across all clusters in your enterprise. A wide range of filters, progressive delivery views, and enriched CI and CD information, provide full traceability and visibility of deployments.
Select the view format for applications in the GitOps Apps dashboard, as either List or Card views. The default view displays all applications deployed within the last 30 days. Customize the scope through filters to display the information you need.
Identify applications with health and sync errors, and then select an application to drill down into its resources, deployments, and services:
- Get status from application header
- Analyze out-of-sync applications in Diff View
- View deployment and configuration summary for selected Argo CD application
- Monitor resources for selected Argo CD application
- Monitor deployments for selected Argo CD application
- Monitor services for selected Argo CD application
TIP
Codefresh adds a whole new dimension to monitoring Argo CD applications through two unique GitOps dashboards: GitOps Environments and GitOps Products.
For information on creating and managing Argo CD applications, application resources, and Application Groups, see Creating Argo CD applications and Managing Argo CD applications.
GitOps Environments & Argo CD applications
To track, optimize, and manage deployments at scale you need a way to visualize applications at every stage of their development and deployment lifecycle. Our custom Environment resource allows you to do just this without the need for complex configuration and maintenance overhead.
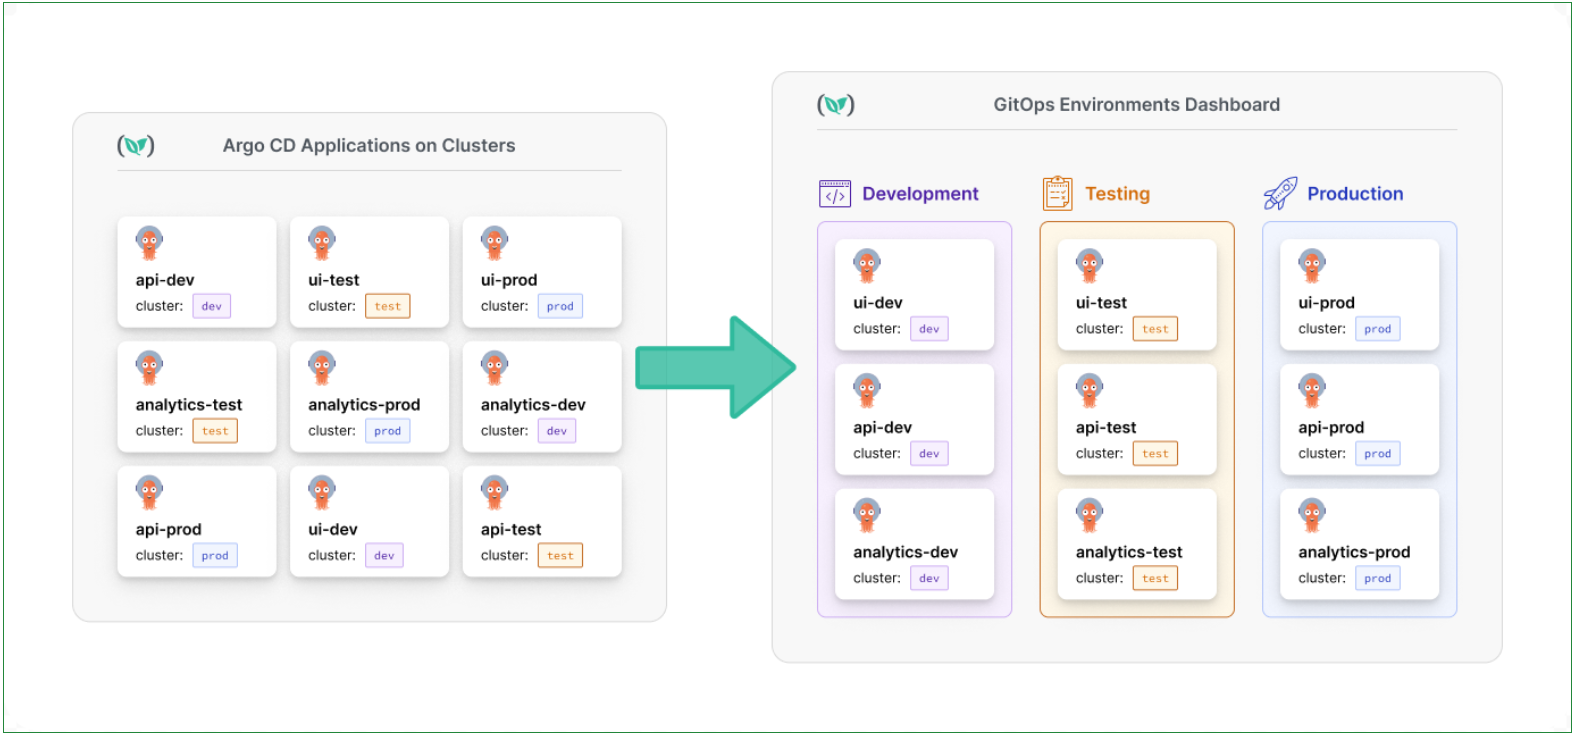
Create Environments by defining one or more pairs of clusters and namespaces for it. Codefresh collates the data on these Environments, populates them with the applications deployed to the target clusters and namespaces. Visualize the environments and their applications in the GitOps Environments dashboard to track promotions and view version and details on the most recent commits that caused the change.
Here’s a visualization of Argo CD applications in the GitOps Environments dashboard.
For detailed information on how to work with Argo CD applications and Environments in Codefresh, see GitOps Environments.
GitOps Products & Argo CD applications
The Product is another custom resource from Codefresh, also enhancing application management at scale. As teams expand and applications and services multiply, keeping track of deployments across various environments can become challenging, if not unmanageable.
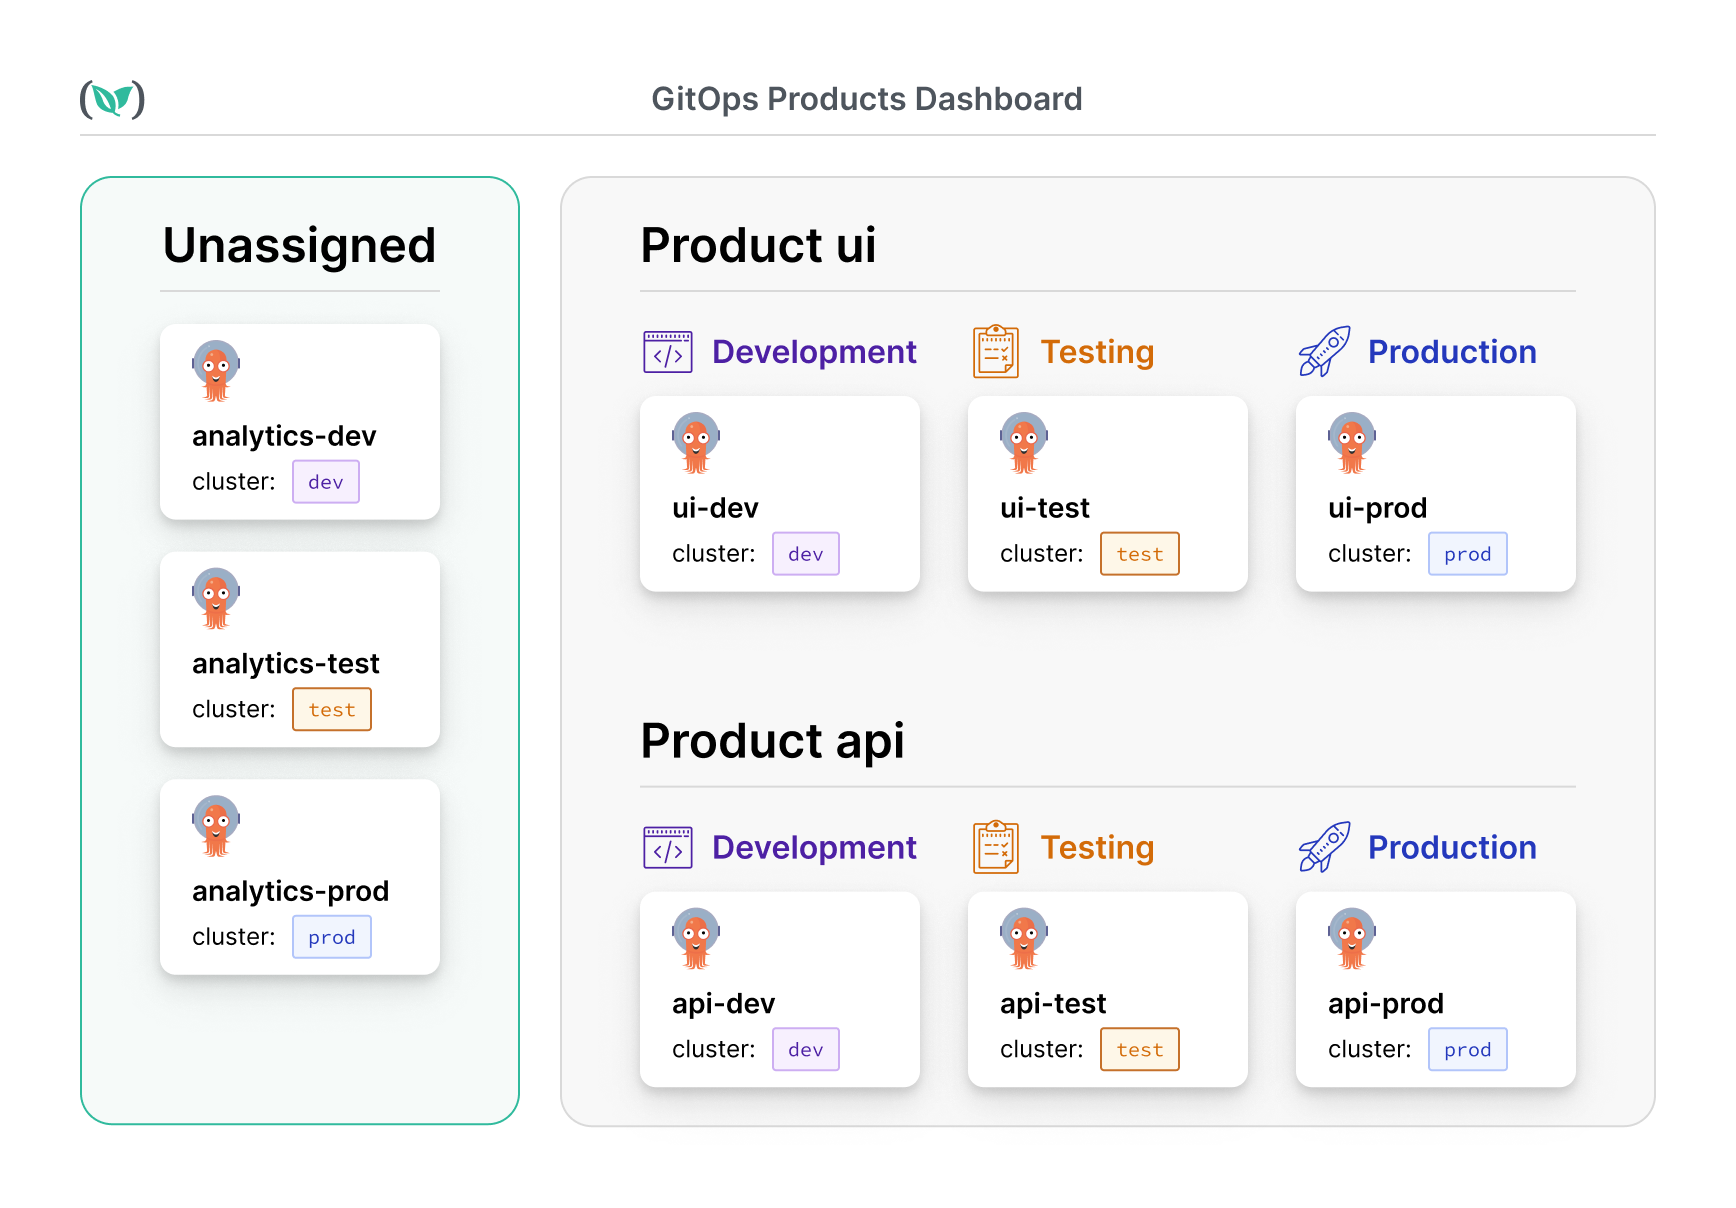
Instead of having to switch between applications, or switch across multiple tools to track and manage different aspects of deployments, Products allow you to group applications into cohesive units, simplifying viewing, tracking, and management. Codefresh seamlessly collates the Environments where each application in the Product is deployed, along with insights into commits, contributors, and features deployed across versions.
Here’s a visualization of Argo CD applications grouped by Products in the GitOps Products dashboard.
For detailed information on how to work with Argo CD applications and Products in Codefresh, see GitOps Products.
Select view mode for the GitOps Apps dashboard
View deployed applications in either List (the default) or Card views. Both views are sorted by the most recent deployments.
- In the Codefresh UI, from Ops in the sidebar, select GitOps Apps.
- Select List or Cards.
Applications List view
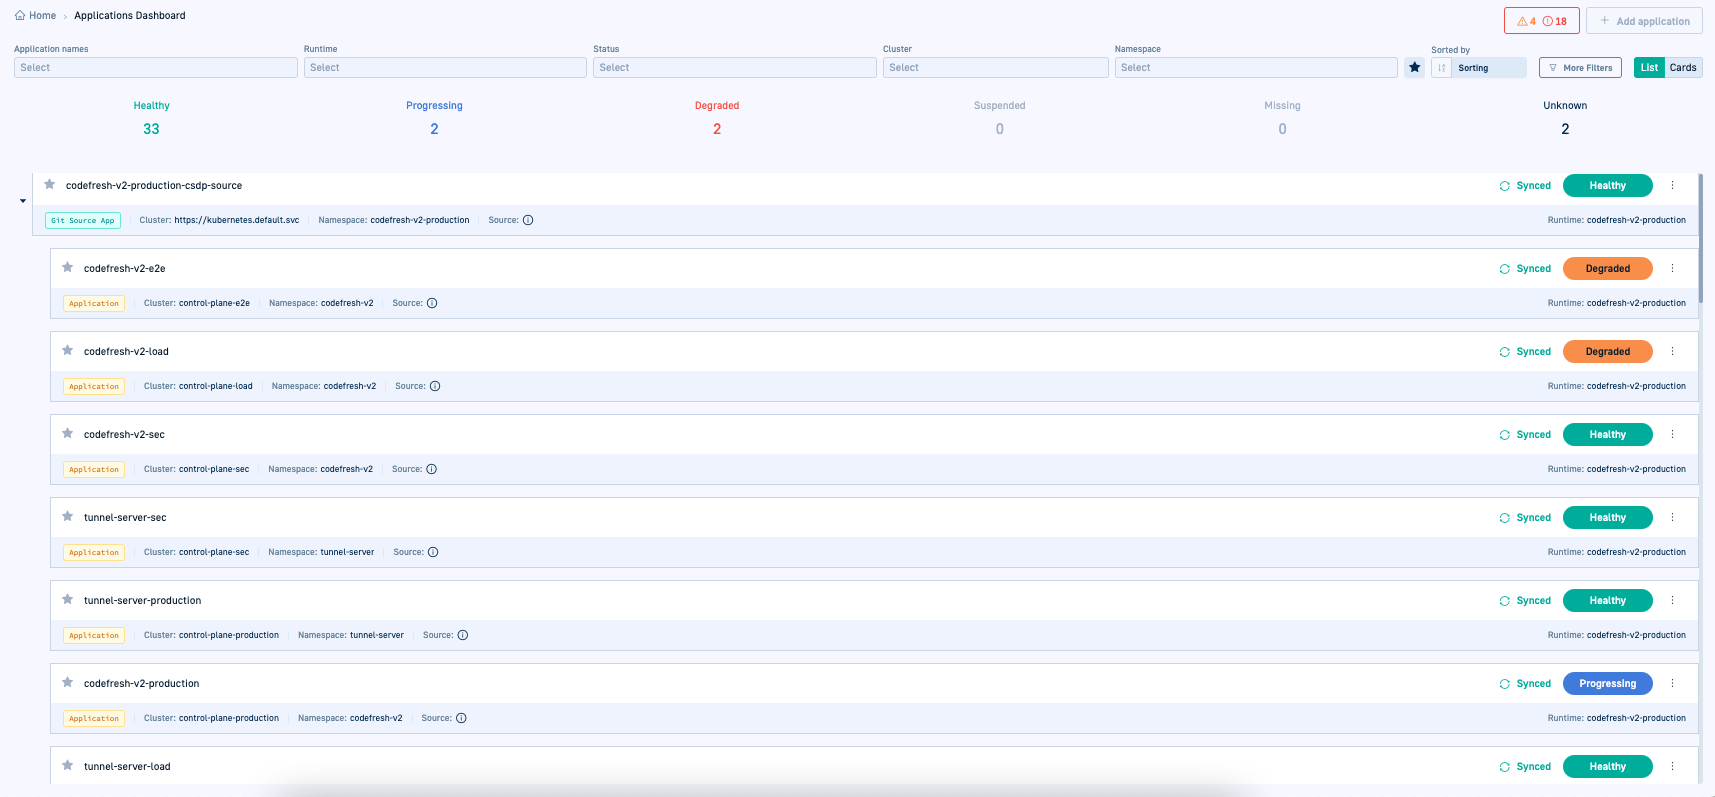
Here is an example of the GitOps Apps dashboard in List view mode.
Applications Card view
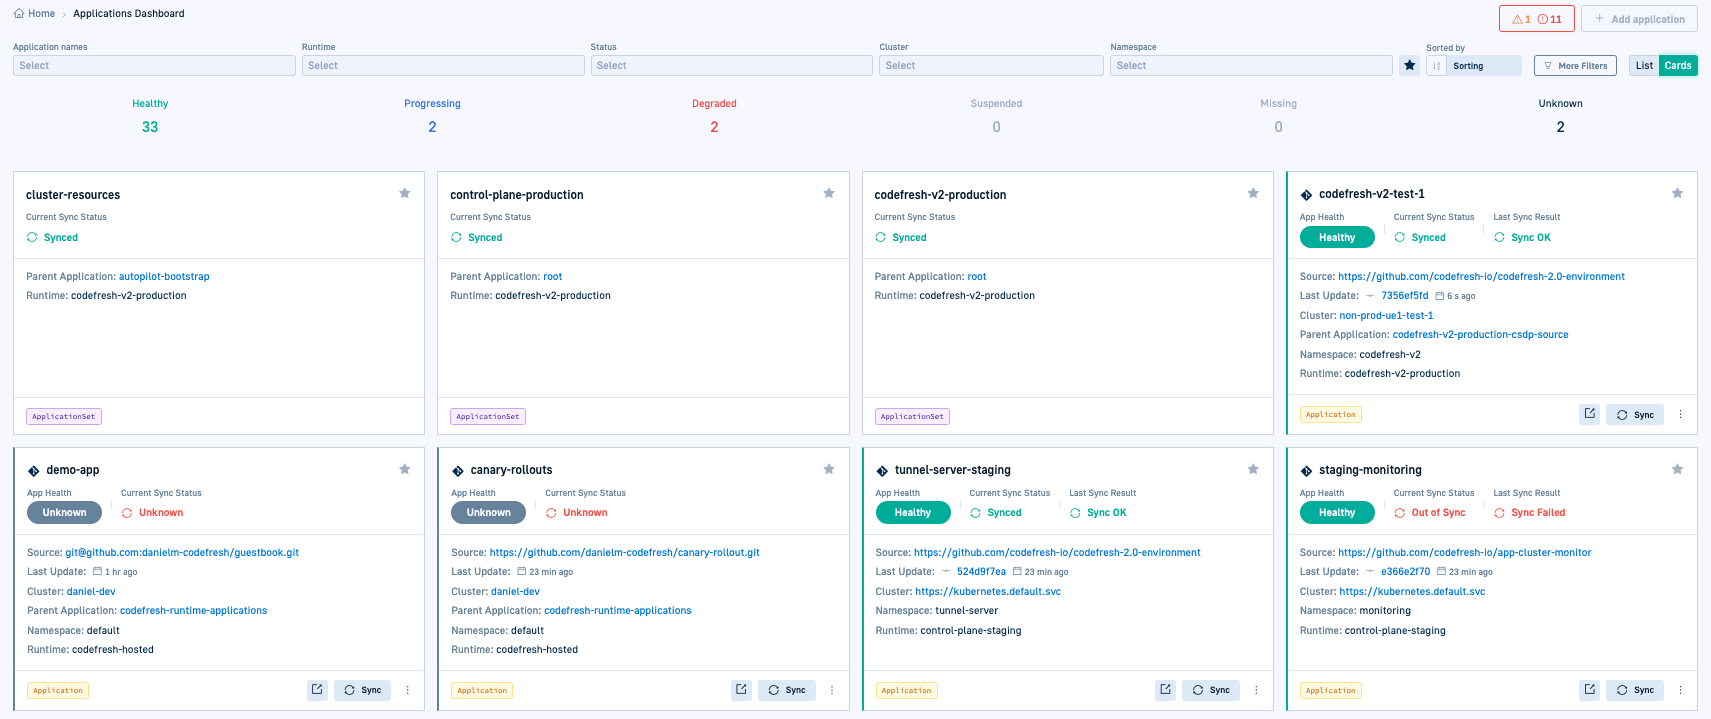
Here is an example of the GitOps Apps dashboard in Card view mode. The Card view provides a scannable view of application data and the actions to manage applications.
GitOps Apps dashboard application information
Here’s a description of the information and actions you can see for individual applications in the Applications tab of the GitOps Apps dashboard.
| Item | Description |
|---|---|
| Application filters | Filter by a range of attributes to customize the information in the dashboard to bring you what you need.
|
| Star applications as favorites and view only the starred applications. Select the To filter by favorite applications, on the filters bar, select TIP: If you star applications as favorites in the GitOps Apps dashboard, you can filter by the same applications in the DORA metrics dashboard. |
|
| Application actions | Options to monitor/manage applications through the application’s context menu.
|
Identify Argo CD applications with warnings/errors
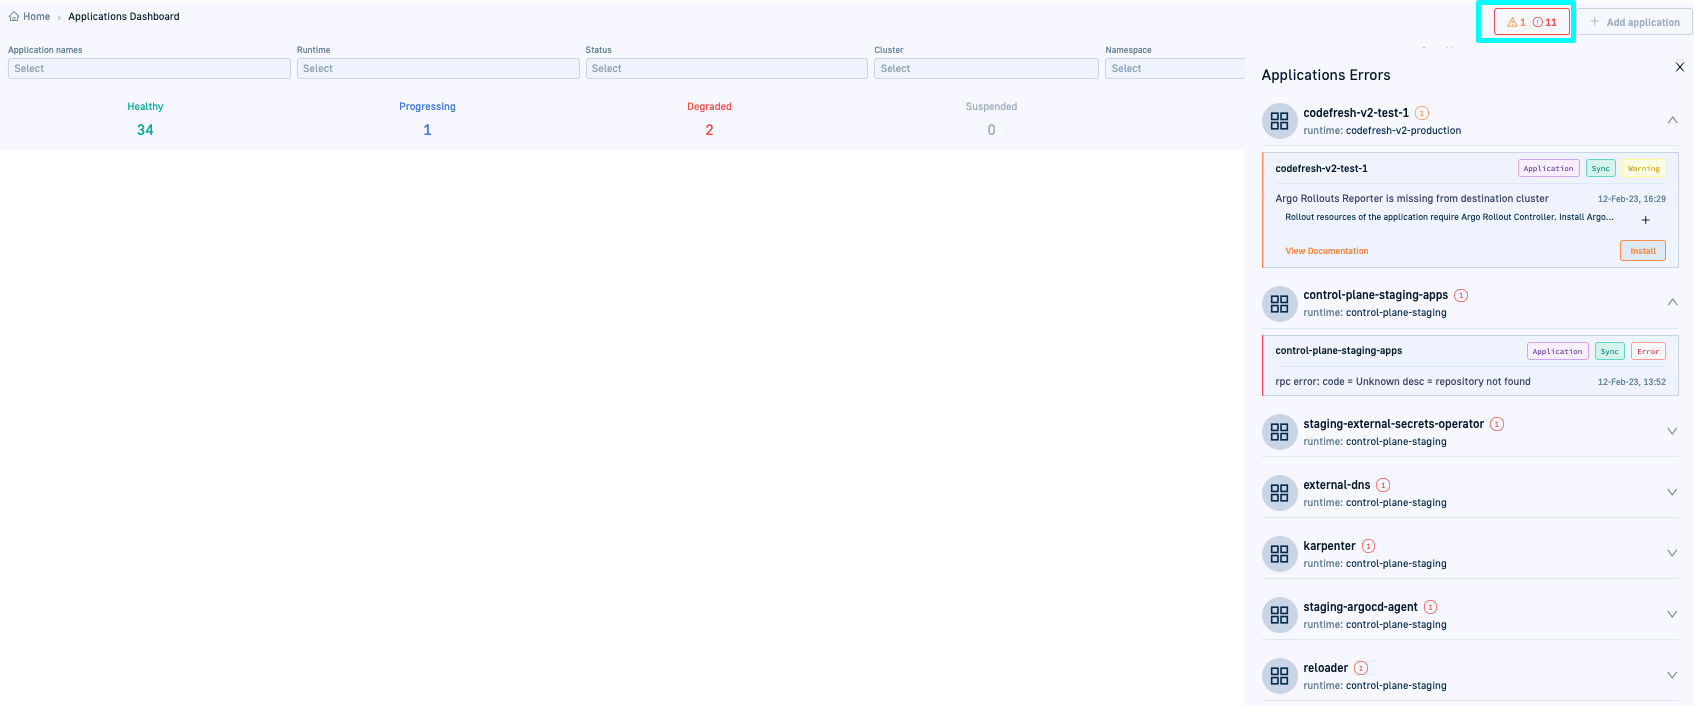
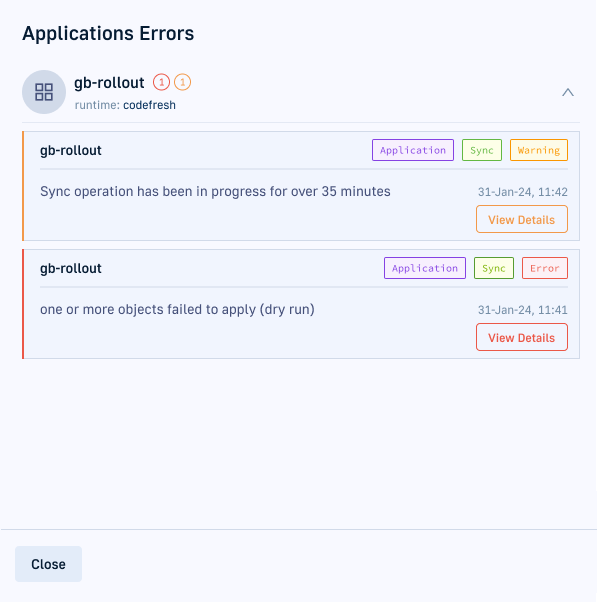
Errors are flagged in the Warnings/Errors button, displayed at the top right of the Applications tab in the GitOps Apps dashboard. Clicking the button shows the list of applications with the warnings/errors and the possible reasons for these.
Every notification identifies:
- The type of resource with the problem (
Application,Deployment,Pod) - If it is health or sync related
- If it is a warning or error.
All errors are Argo CD-generated errors. Codefresh generates custom warnings for missing Rollouts reporter and longer than expected sync operations.
Warning: Missing Rollouts reporter in cluster
Reason: Codefresh has detected that Argo Rollouts is not installed on the target cluster. Rollout instructions are therefore not executed and the application is not deployed.
Applications with rollout resources need Argo Rollouts on the target cluster, both to visualize rollouts in the GitOps Apps dashboard and control rollout steps with the Rollout Player.
Corrective Action: Click Install and install Argo Rollouts on the target cluster.
Warning: Long sync
Reason: Ongoing sync for application exceeds the configured timeout.
The Codefresh default is Argo CD’s default duration of 30 minutes for a sync operation.
Corrective Action:
- Click View Details to take you directly to the Sync Result tab. Here you can see details on the sync job that was started, and info on the Hooks if any. Failed hooks are displayed at the top.
- To see more details such as the message and sync duration, switch to Sync Info.
- Drill down into the application to investigate the issue and make changes.
Monitoring status of Argo CD application in Application Header
When you select an application from the Applications tab in the GitOps Apps dashboard, the Application Header, at the top of the page, displays the information you need on the current release, including health and sync statuses.
The Application Header is always displayed for the selected application, no matter what tab you navigate to.
Correlate details such as the sync revision in the Application Header with the release revision in the Current Release’s deployment record in the Timeline tab.
Information and actions in the Application Header
- App Health displays health status of the current release.
- Current Sync sync status of the current release with the sync revision. The sync revision should be identical to the release revision in the Current Release deployment record previous sync operation.
- Auto-sync enabled/disabled indication.
- More links for sync statuses for details on the date, tags, and message.
- Terminate Sync option for active sync operations to stop the sync if needed.
TIP
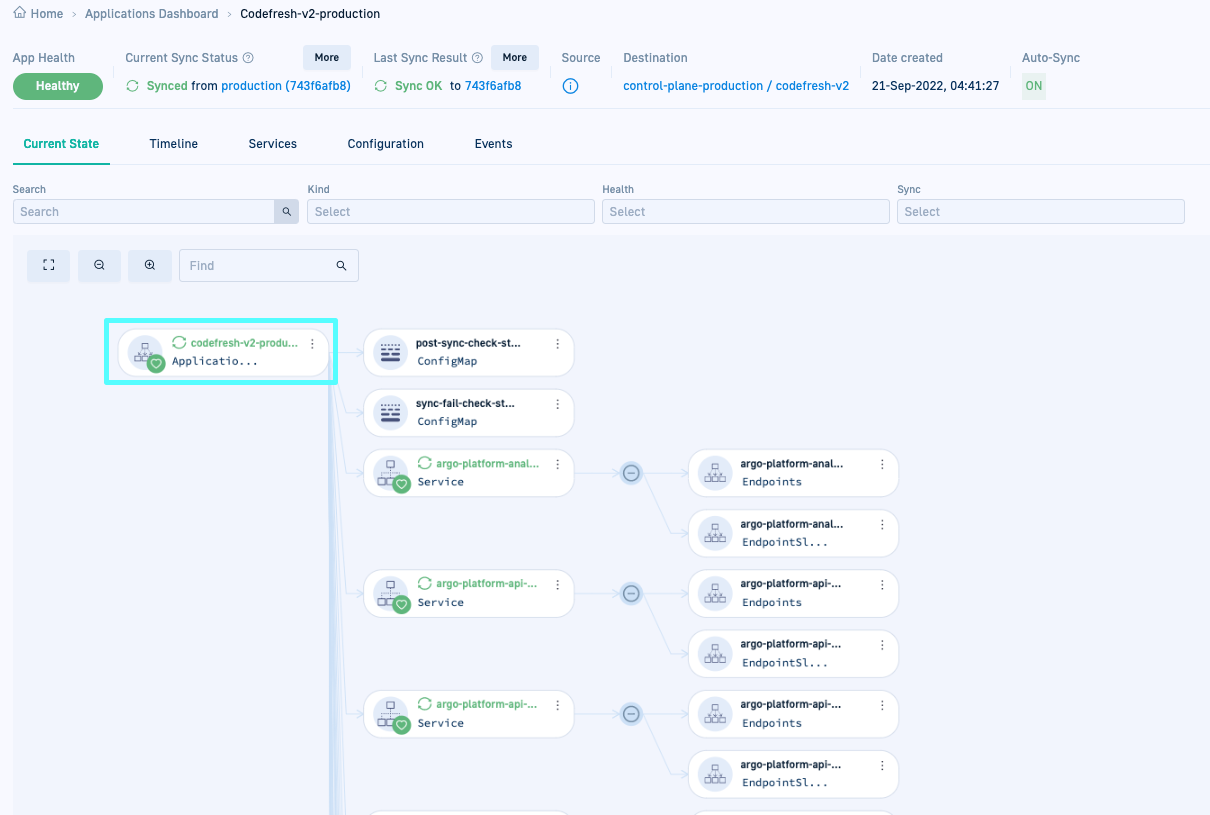
You can also view the current health and sync status for the application as a resource in the Current State tab.
Analyze out-of-sync applications with Diff View
Identify discrepancies between the desired and live states for out-of-sync applications using Diff View. The Diff View provides a visual representation of discrepancies to help troubleshoot issues more effectively.
Available in the context menu when you select an application, the Diff View presents Inline and Split views, in either full or summary modes.
- In the Codefresh UI, from Ops in the sidebar, select GitOps Apps.
- Filter by Status for Out of sync applications, and select the application you need.
- From the context menu on the upper-right, select Diff View.
The default Diff View highlights the differences in Inline and Compact view modes.
- For side-by-side comparison and a detailed view, switch to Split view, and clear Compact diff.
View deployment and configuration summary for selected Argo CD application
View deployment, definition, and event information for the selected application in a centralized location through the Quick View.
A read-only view, the Quick View displays information on the application state and location, labels and annotations, parameters, sync options, manifest, status and sync events.
Access the Quick View from the GitOps Apps dashboard, either from the application’s context menu, or after drill down, from the Current State tab.
- In the Codefresh UI, from Ops in the sidebar, select GitOps Apps.
- Do one of the following:
- From the List or Card views, select the context menu and then select Quick View.
- Select the application, and from the application header’s context menu on the right, select Details.
- Select the application, and in the Current State tab, click the parent application resource.
The Quick View includes the following tabs:
- Summary: Displays health, sync status, and source and destination definitions.
- Metadata: Displays labels and annotations for the application.
- Parameters: Displays parameters configured for the application, based on the tool used to create the application’s manifests.
The parameters displayed differ according to the tool:directory,Helmcharts, orKustomizemanifests, or the specific plugin. - Sync Options: Displays the sync options enabled for the application.
- Manifest: Displays the YAML version of the application manifest.
- Events: Displays status and sync events for the application.
Monitoring resources for selected Argo CD application
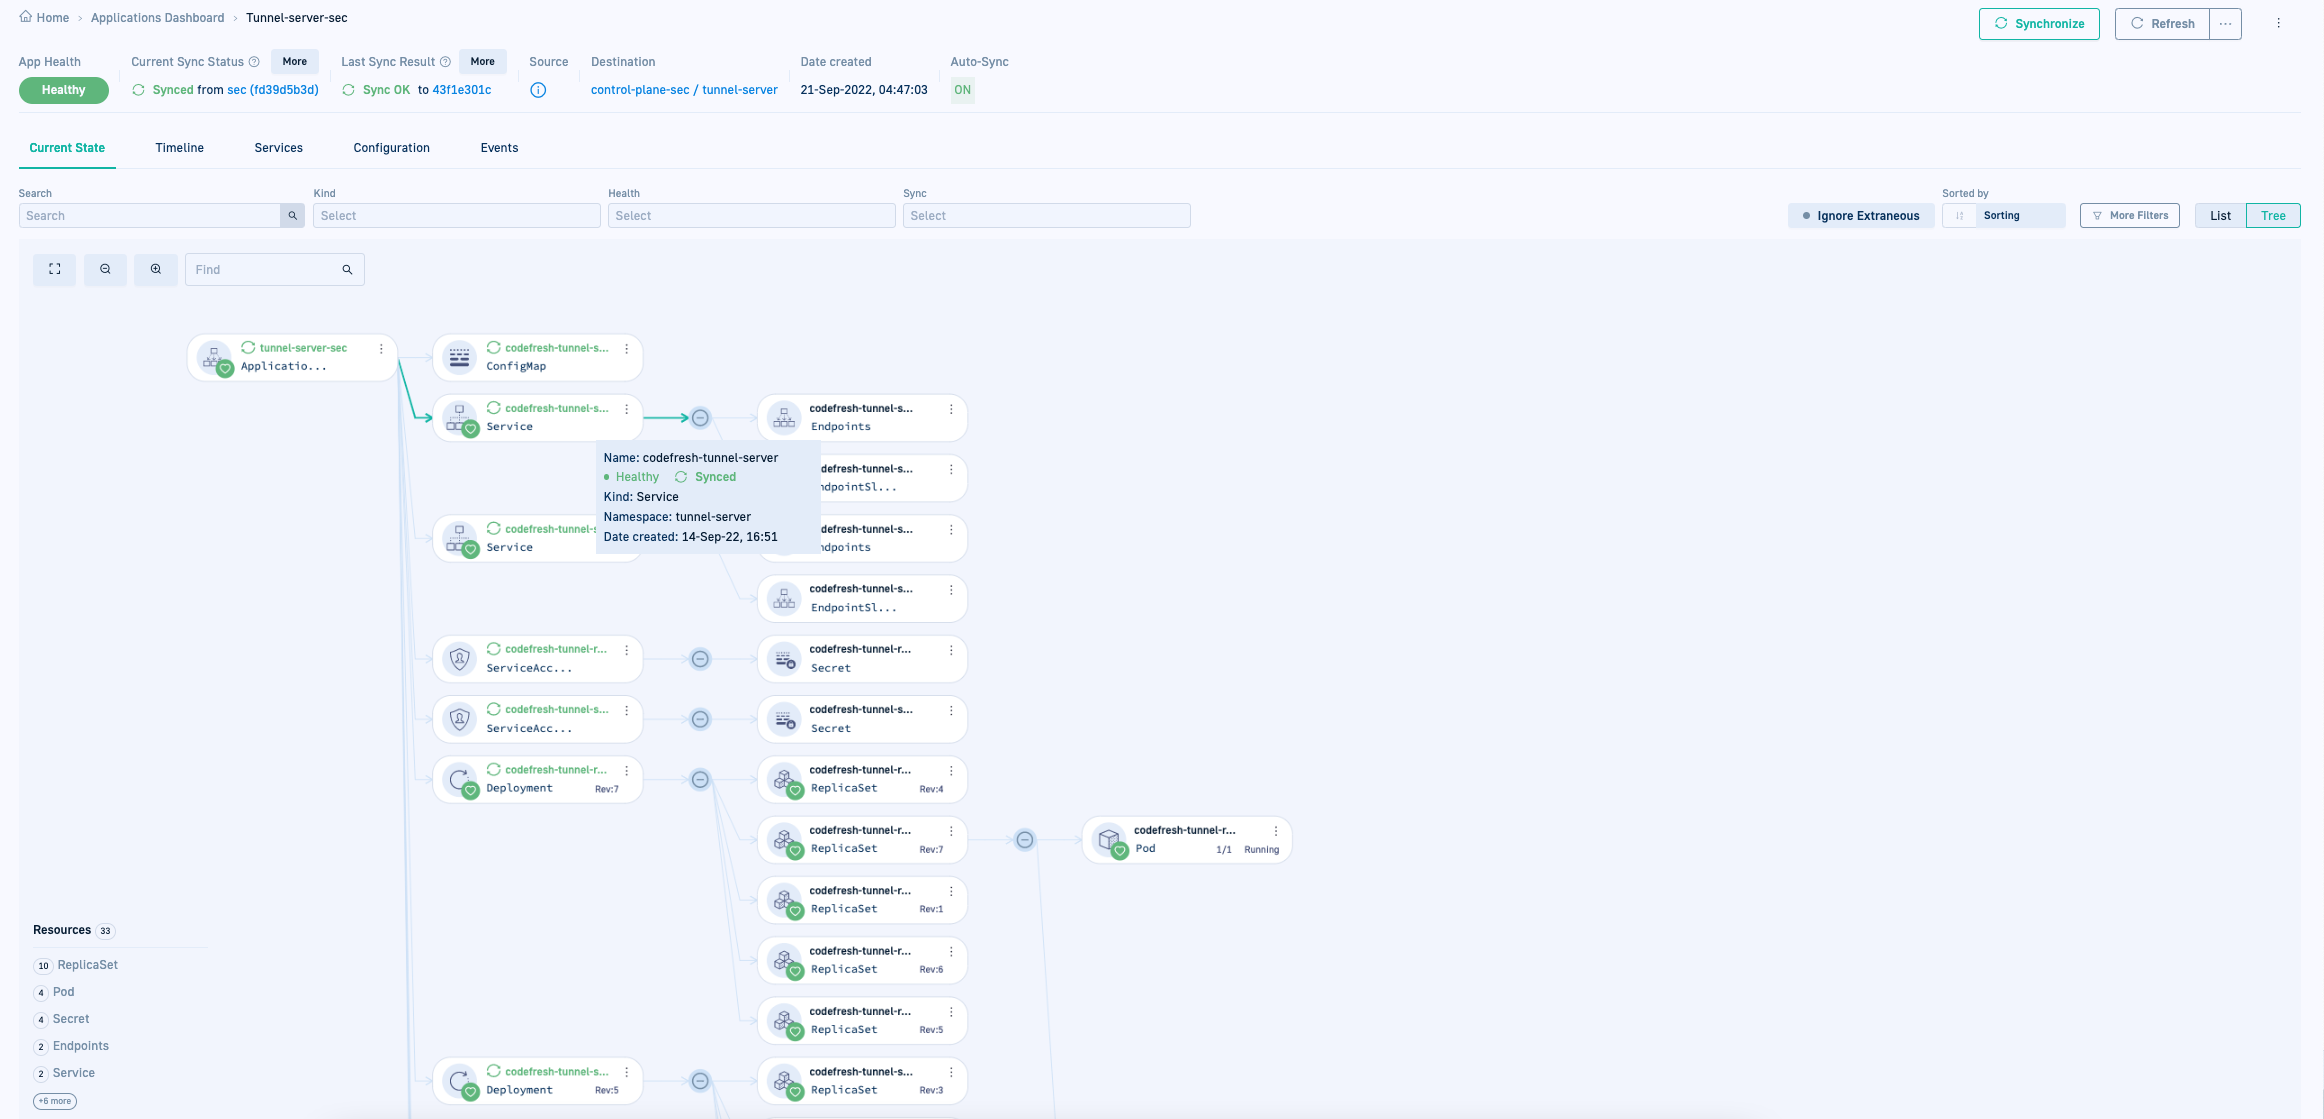
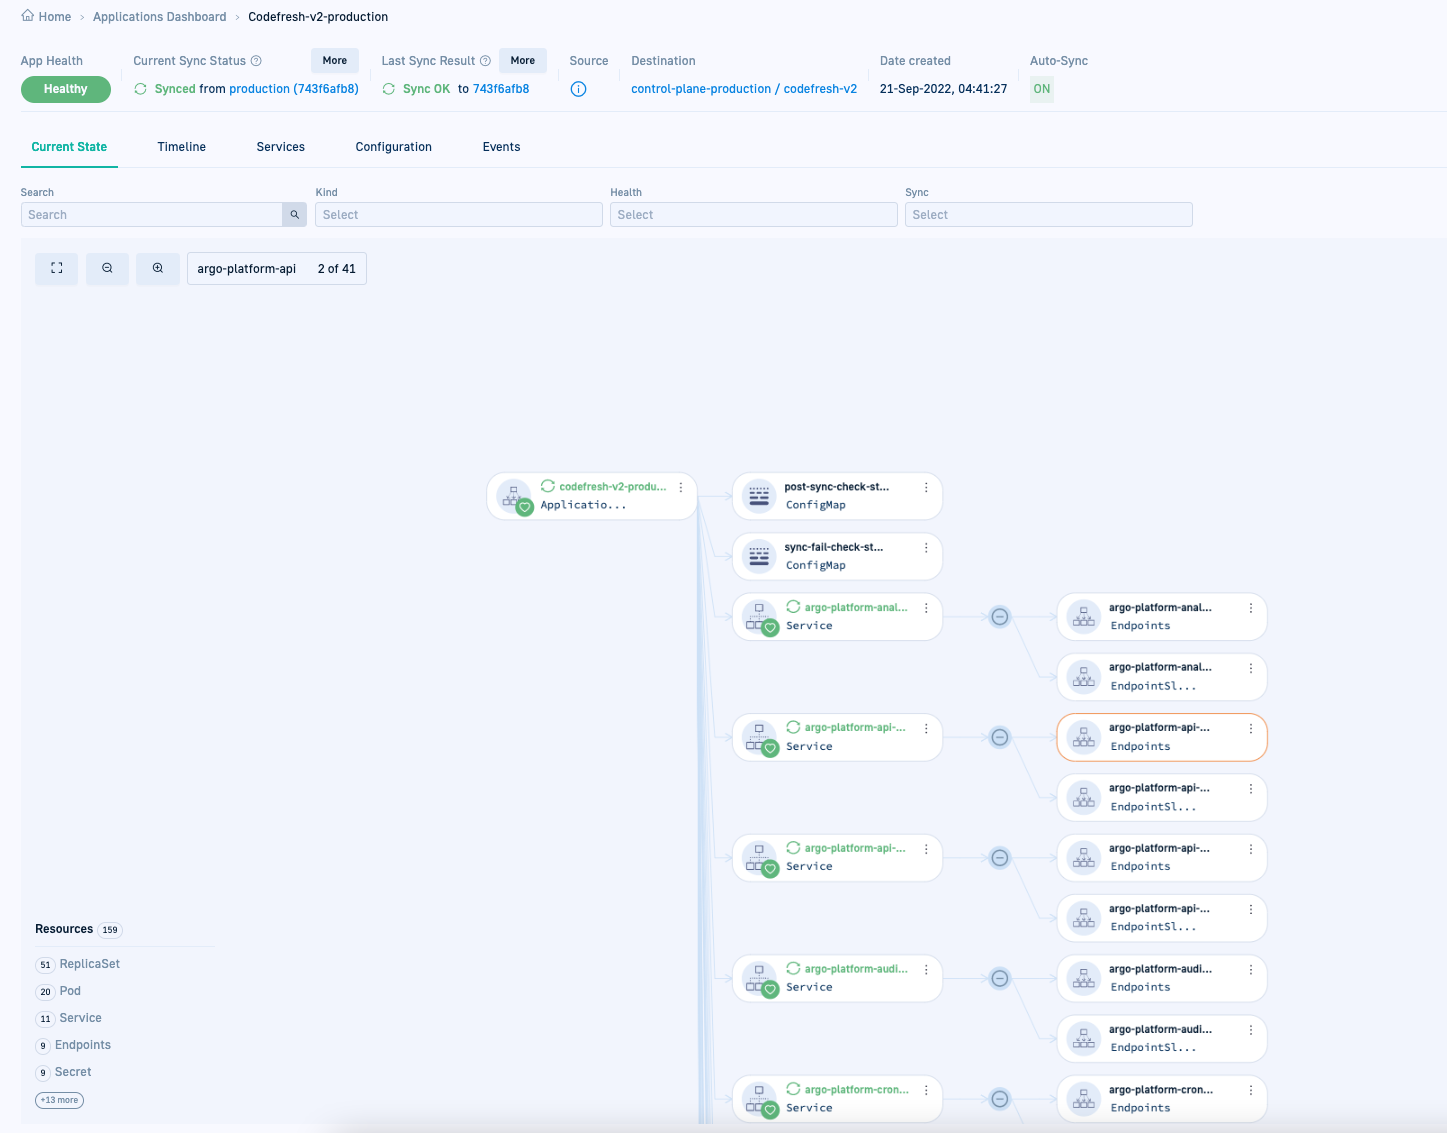
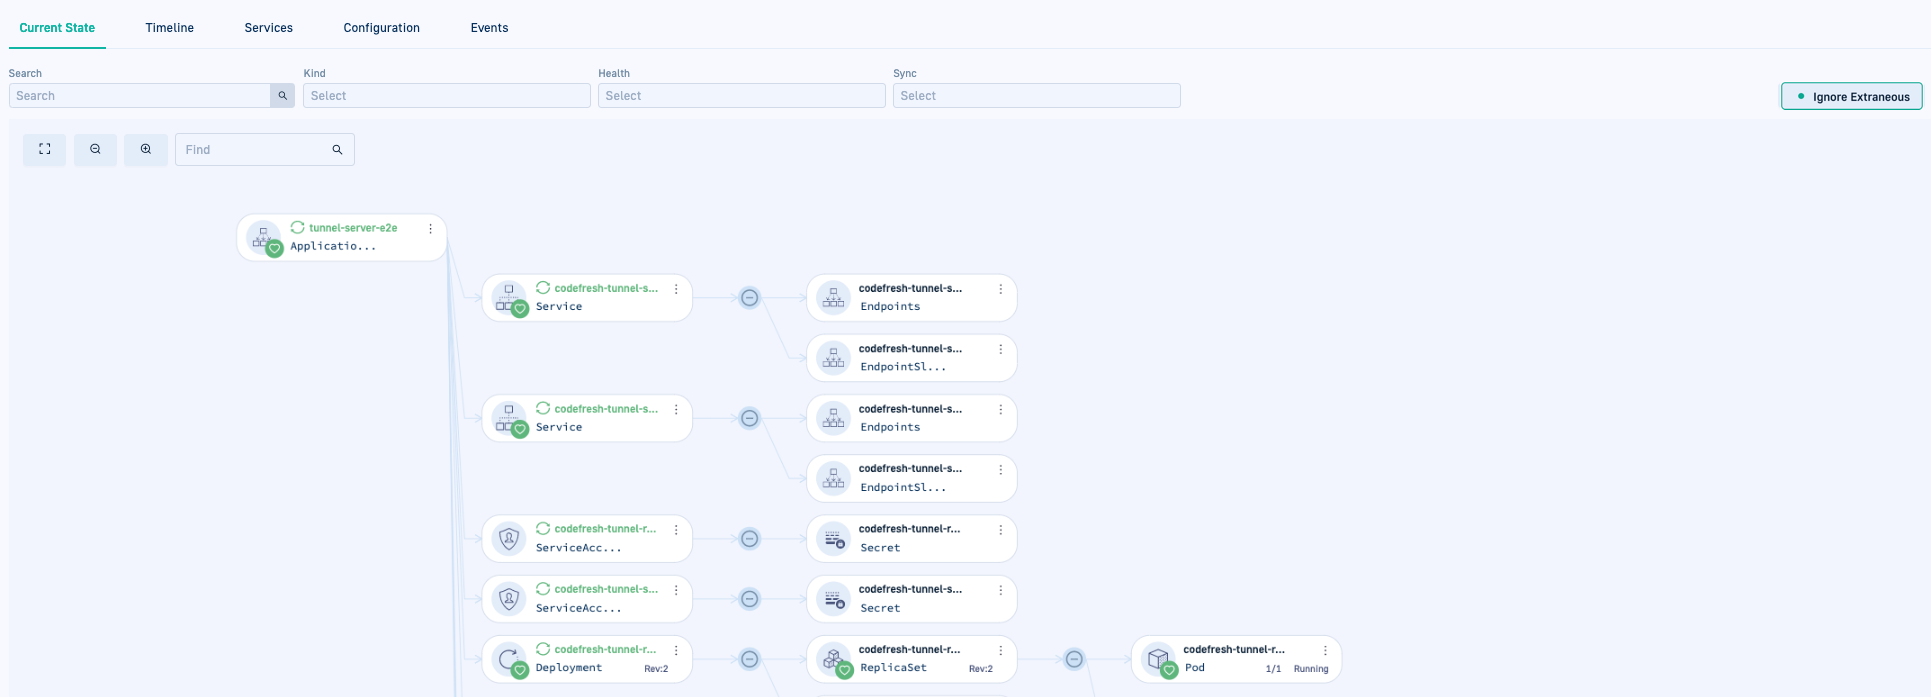
Monitor the resources deployed in the current version of the selected application in the Current State tab.
Selecting an application from the GitOps Apps dashboard takes you to the Current State tab, which as its title indicates, displays the
live state of the application’s resources (Kubernetes objects) on the cluster, including health, sync state, manifests, and logs.
The icon for a resource node identifies the type of Kubernetes resource it represents. For information on K8s resources, see Working with Kubernetes objects.
What can you do with application resources?
- View application resources in List or Tree views
- Filter resources to focus on what’s important
- Access external links if defined
- Delete resources
- Monitor resources:
View modes for application resources
The Current State tab supports Tree and List view formats.
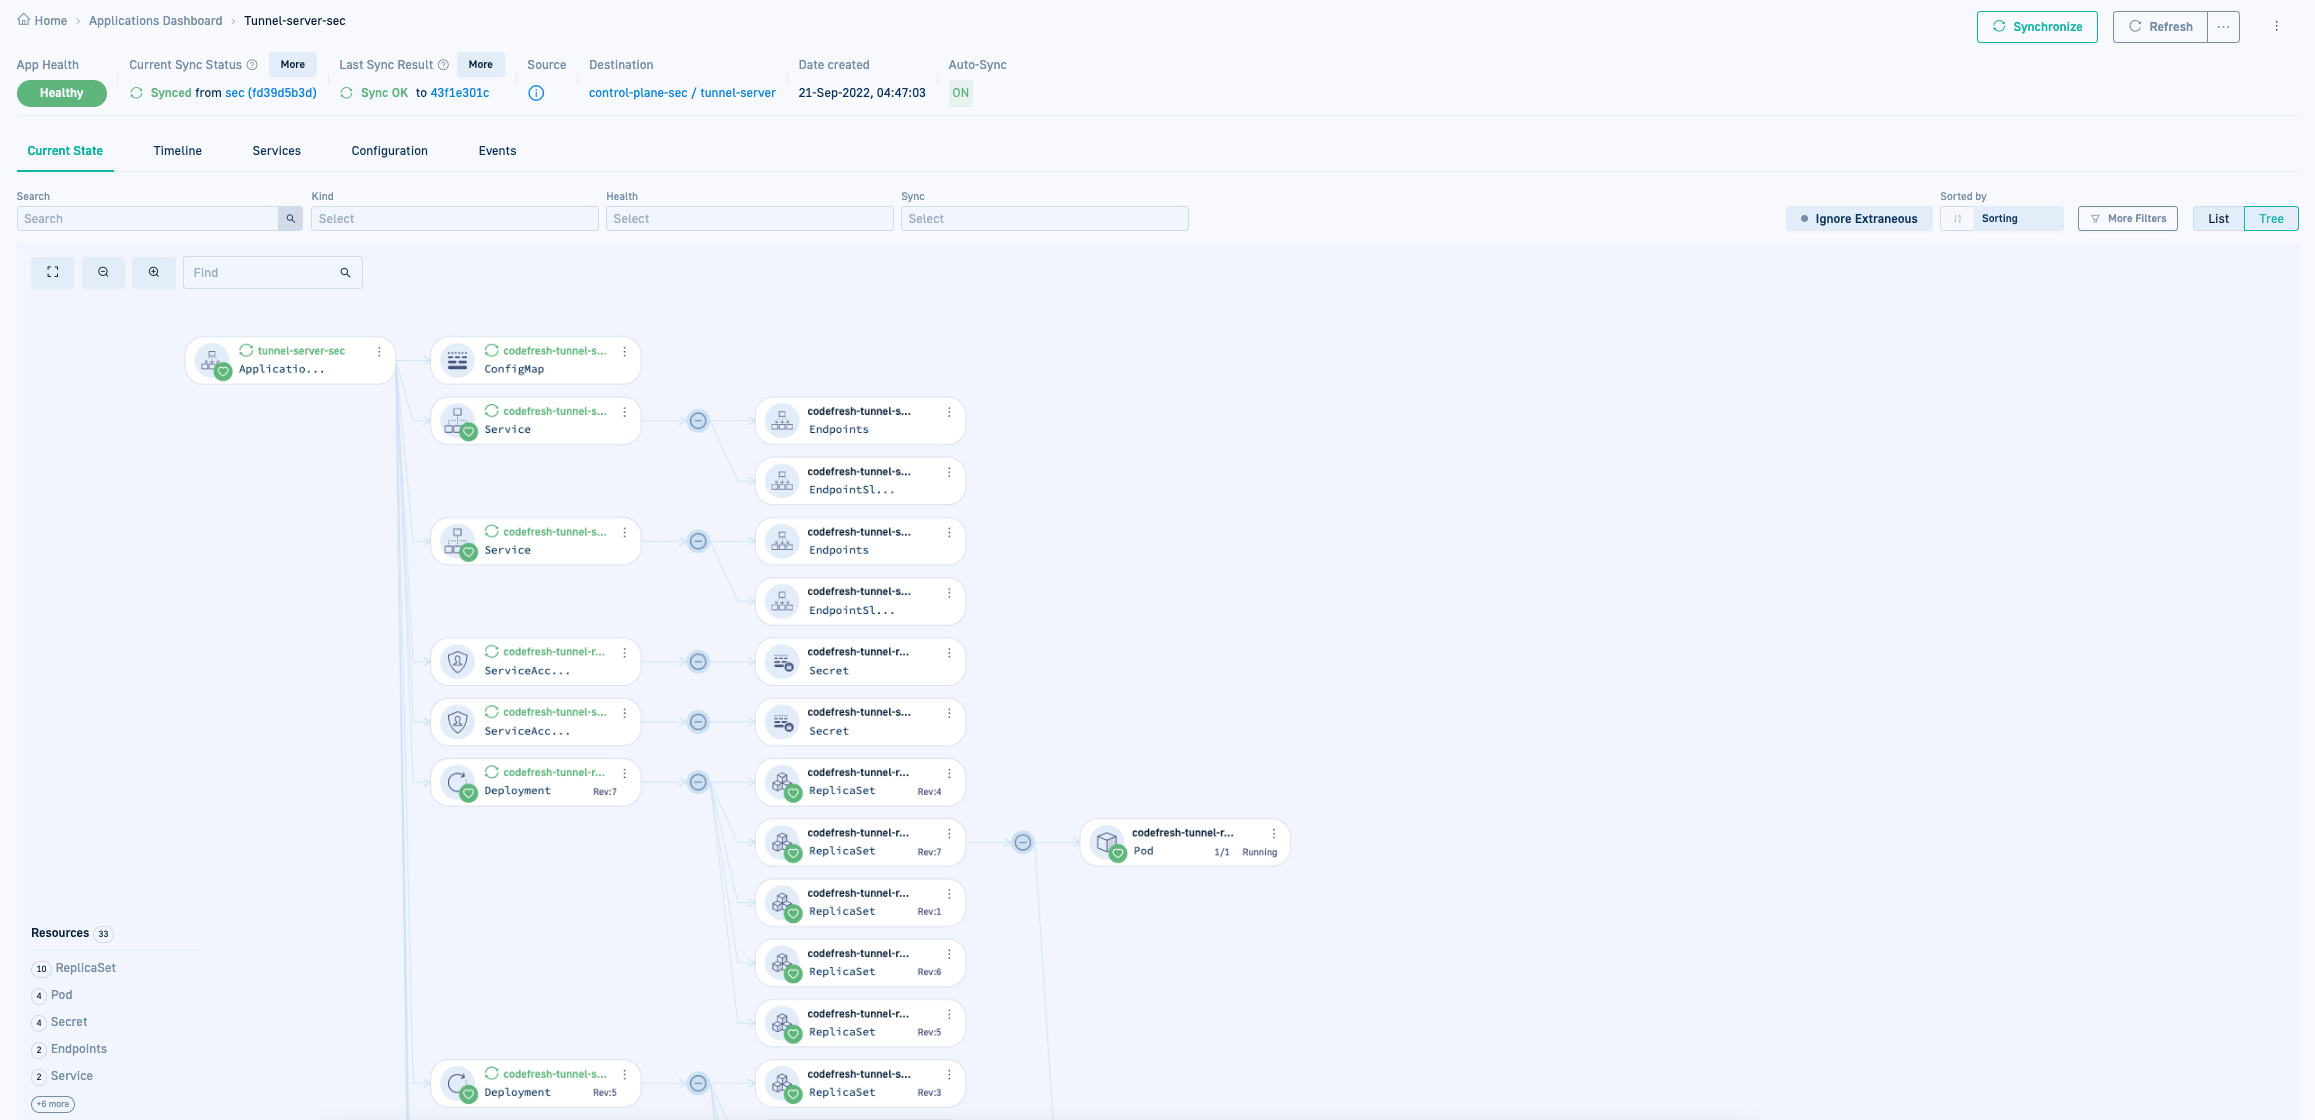
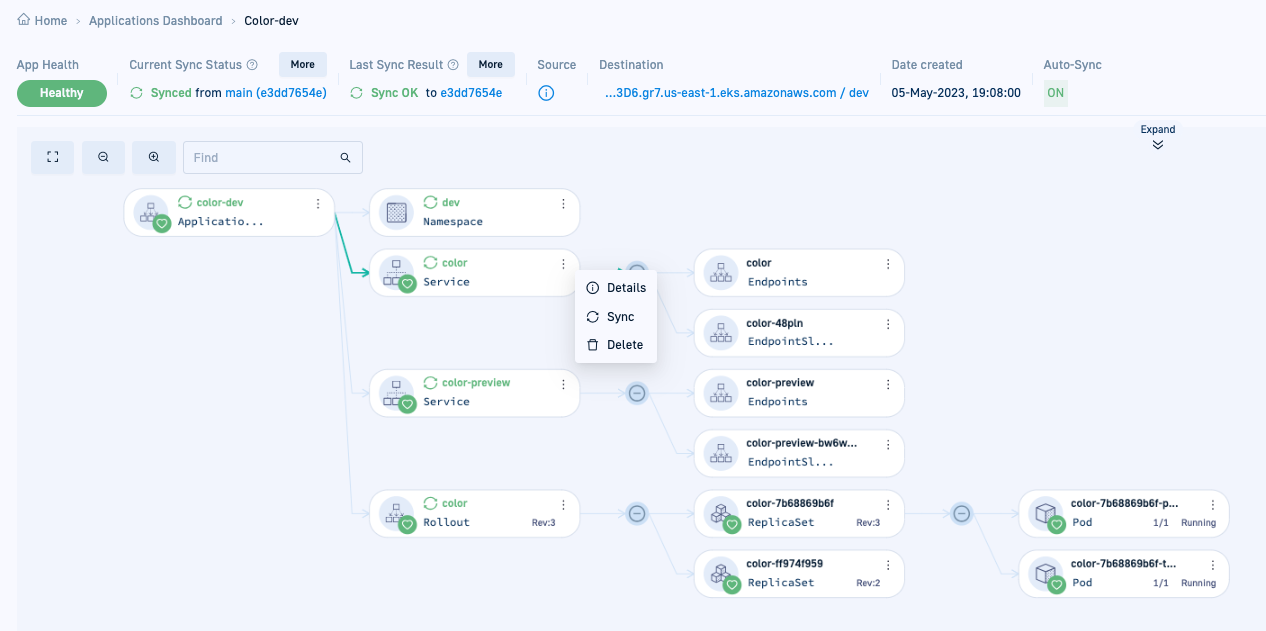
- Tree view (default): A hierarchical, interactive visualization of the application and its resources. Useful for complex deployments with multiple clusters and large numbers of resources. See also Working with resources in Tree view.
Here is an example of the Current State in Tree view.
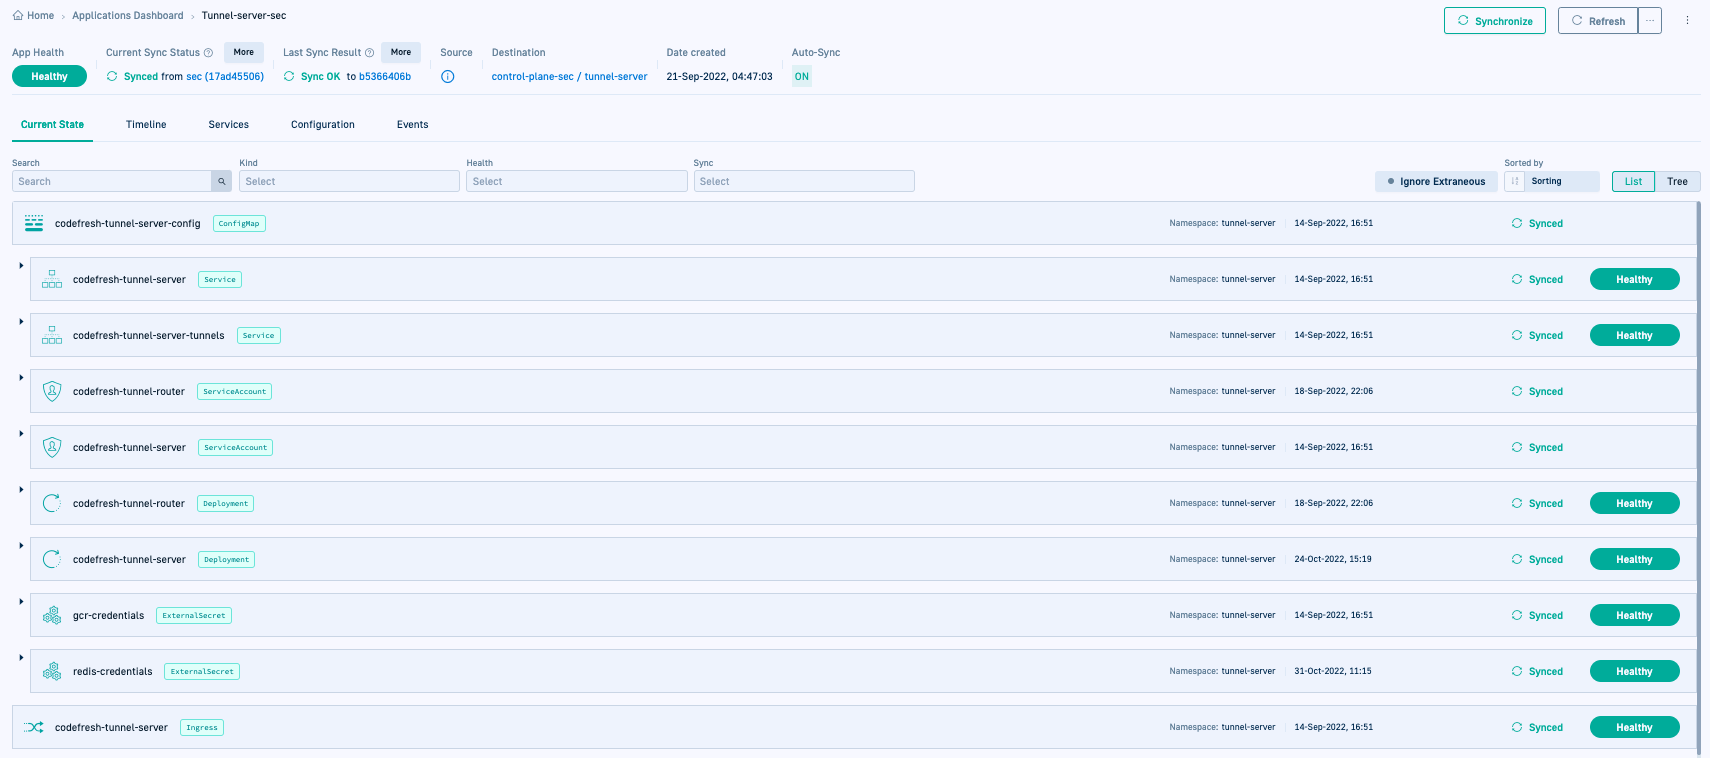
- List View: A list-based representation of application’s resources, sorted by the Last Update. Here is an example of the Current State in List view.
Working with resources in Tree view
The Tree view is designed to impart key information at a glance. Review the sections that follow for pointers to quickly get to what you need in the Tree view.
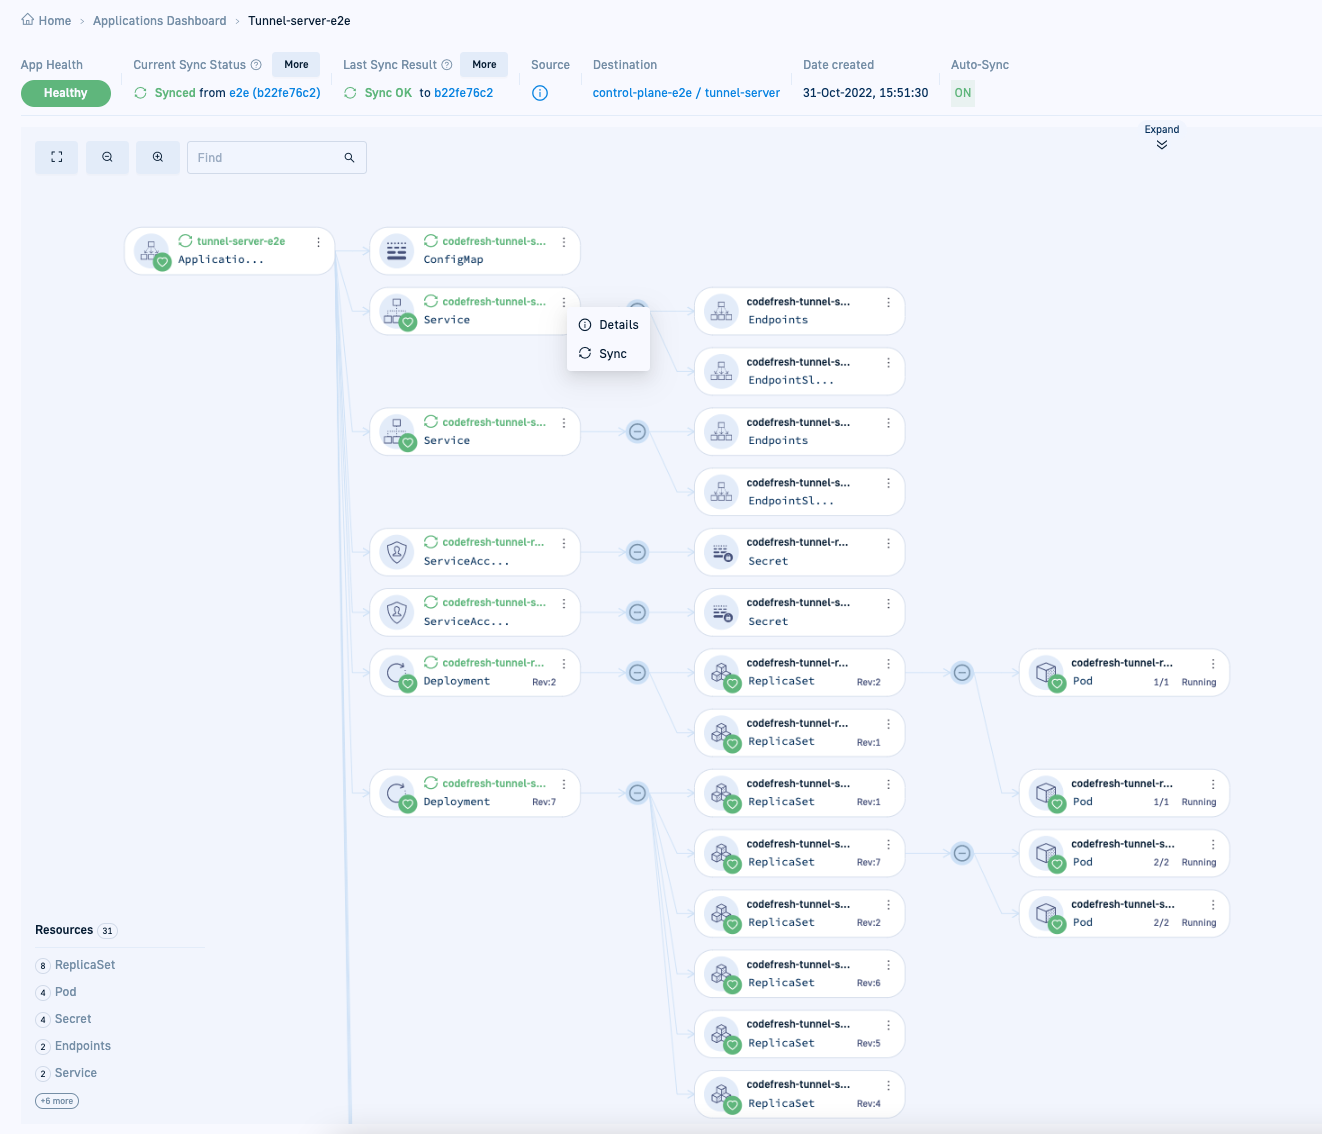
Context menu
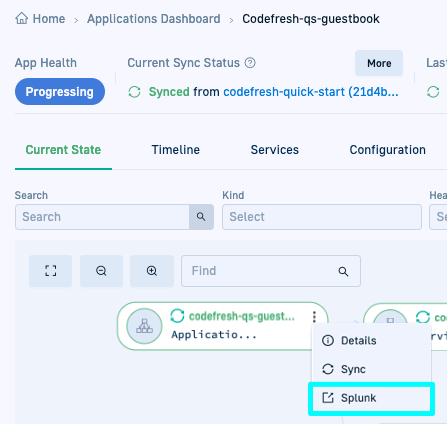
Every resource has a context menu that opens on clicking the three dots on the right of the resource. The options available differ according to the type of resource.
TIP
If you have deep links configured for applications/resources for Hybrid GitOps Runtimes, these are also displayed in the context menu. To configure deep links in Codefresh, see (Hybrid GitOps) Configure Deep Links to applications & resources.
Resource info
Mouse over a node to see a tooltip for that resource. For detailed information, select the resource.
Search resources
Quickly find a resource by typing the resource name in the search field. You can identify search results through the border which is different from the borders depicting health status. Press Enter to navigate to the next result.
Resource inventory
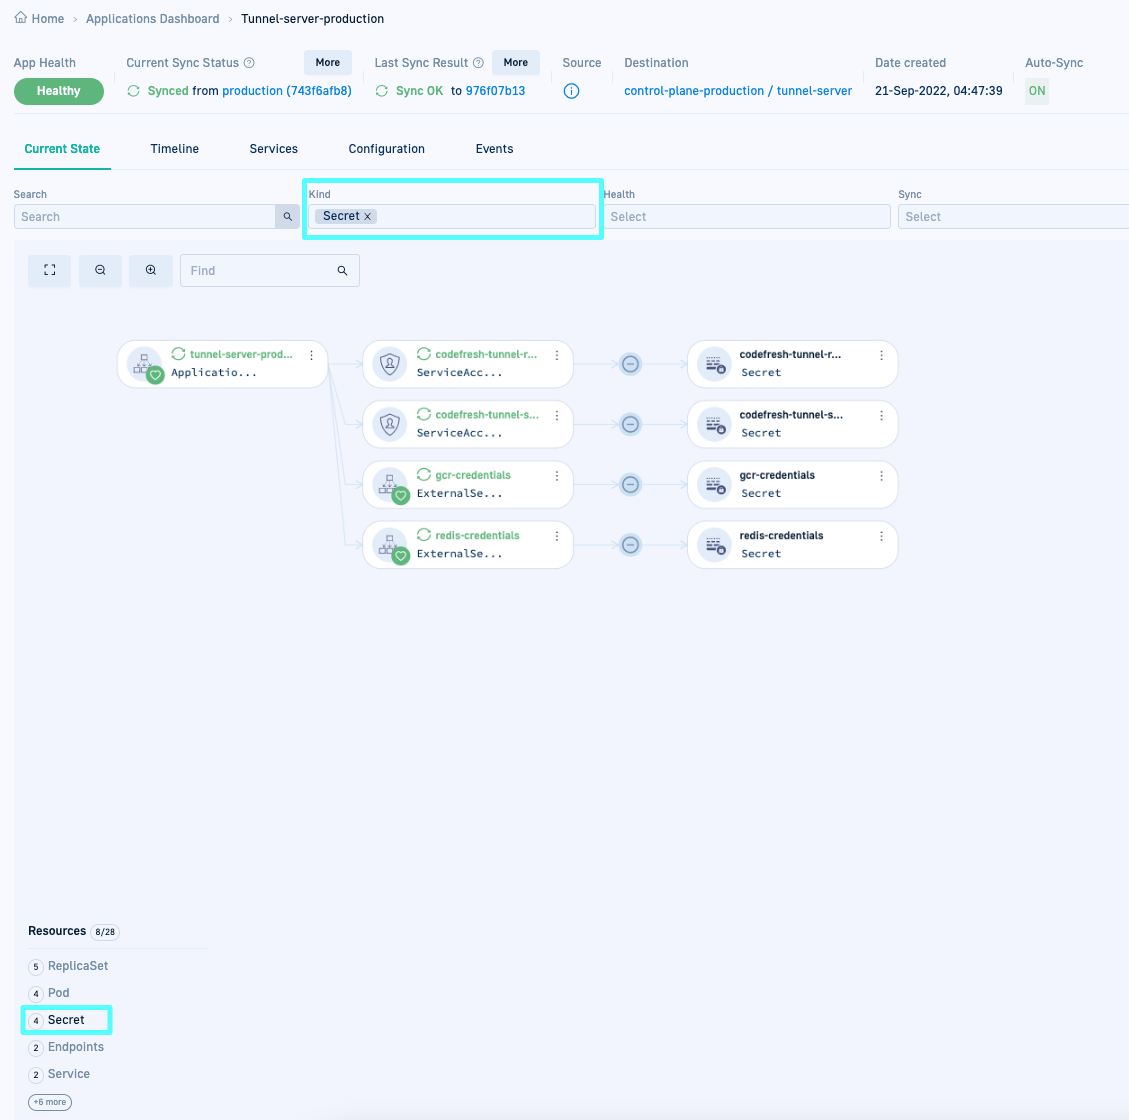
The Resource inventory in the Tree view (bottom-left), summarizes the aggregated count for each resource type in the application. The number of out-of-sync items for that resource type if any are numbered in red.
Click-filters:
Selecting any resource type, filters the Current State by that resource type and sync status. These filters are automatically applied to the default filter list for both Tree and List views. Here’s an example of an application with out-of-sync resources, and the result on selecting an out-of-sync resource type.
Filters for application resources
Filters are common to both Tree and List views, and when applied are retained when switching between views.
IgnoreExtraneous is a filter in Argo CD that allows you to hide specific resources from the Current State views. These resources are usually generated by a tool and their sync statuses have no impact on the sync status of the application. For example, ConfigMap and pods. The application remains in-sync even when such resources are syncing or out-of-sync.
NOTE
TheIgnoreExtraneousfilter applies only to the sync status. The health status of the resource directly affects the application’s health status. If the resource is degraded, then the application is also degraded.
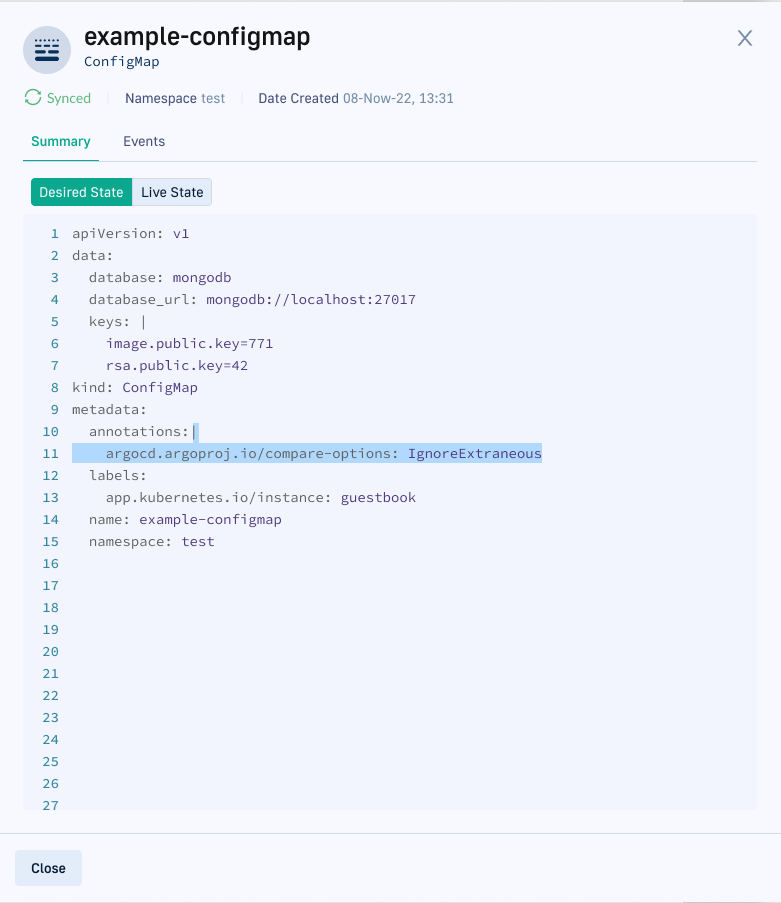
For the IgnoreExtraneous filter to be effective:
- Add
IgnoreExtraneousas an annotation to the resource, as in the example below of theConfigMapresource.
- In the Current State tab, click the
IgnoreExtraneousfilter.
You can see that theIgnoreExtraneousfilter is active and theConfigMapresource is not displayed in the Current State.
Access external links
If your Kubernetes resources have annotations that define external links, the ![]() is displayed below the context menu of the resource. Clicking the icon shows the list of external links configured for the resource.
is displayed below the context menu of the resource. Clicking the icon shows the list of external links configured for the resource.
NOTE
This feature requires GitOps Runtime chart version 0.10.0.
Ingress resources automatically display external links. Clicking ![]() displays the links configured.
displays the links configured.
Use this annotation to add the external link to a Kubernetes resource:
annotations:
  link.argocd.argoproj.io/external-link: http://my-grafana.example.com/pre-generated-link
For more details on this feature, see Argo CD’s documentation on Adding external URLs.
Delete application resources
Delete specific resources in an application directly from the Codefresh UI.
- In the Codefresh UI, from the sidebar, under OPS, select GitOps Apps.
- From the Application dashboard, select the application with the resource to delete.
- From the context menu of the resource, select Delete.
Health status for application resources
View and monitor health status of the selected application’s resources in the Current State tab, in Tree or List views.
Identify the health of an application resource through the icon, as described in the table (Tree view), or the textual labels at the right of the resource (List view).
The table describes the possible health statuses for an application resource in the Tree view.
| Health icon | Health status | Description |
|---|---|---|
| Healthy | Resource is functioning as required. | |
| Progressing | Resource is not healthy but can become healthy before the timeout occurs. | |
| Suspended | Resource is not functioning, and is either suspended or paused. For example, Cron job or a canary rollout. | |
| Missing | Resource is not present on the cluster. | |
| Degraded | Resource is not healthy, or a timeout occurred before it could reach a healthy status. | |
| Unknown | Resource does not have a health status, or the health status is not tracked in Argo CD. For example, ConfigMaps resource types. |
See also Argo CD’s set of health checks.
Sync status for application resources
Similar to the health status, the Current State also tracks the sync status of all application resources. The sync status identifies if the live state of the application resource on the cluster is synced with its desired state in Git.
Identify the sync status through the icon on the left of the resource name (Tree view), or the textual labels at the right of the resource (List view).
The table describes the possible sync states for an application resource in the Tree view.
| Sync icon | Sync state | Description |
|---|---|---|
| Synced | The live state of the resource on the cluster is identical to the desired state in Git. | |
| Syncing | The live state of the resource was not identical to the desired state, and is currently being synced. | |
| Out-of-Sync | The live state is not identical to the desired state. To sync a resource, select the Sync option from the resource’s context menu in Tree view. |
|
| No icon | Unknown | The sync status could not be determined. |
NOTE
The application header displays the statuses of the current and previous sync operations. Clicking More opens the Sync panels with Sync Info, Sync Result and Commit Info. The Application Warnings/Errors panel surfaces sync errors on exceeding the maximum number of retries and when a sync operation extends beyond 30 minutes.
Manifests for application resources
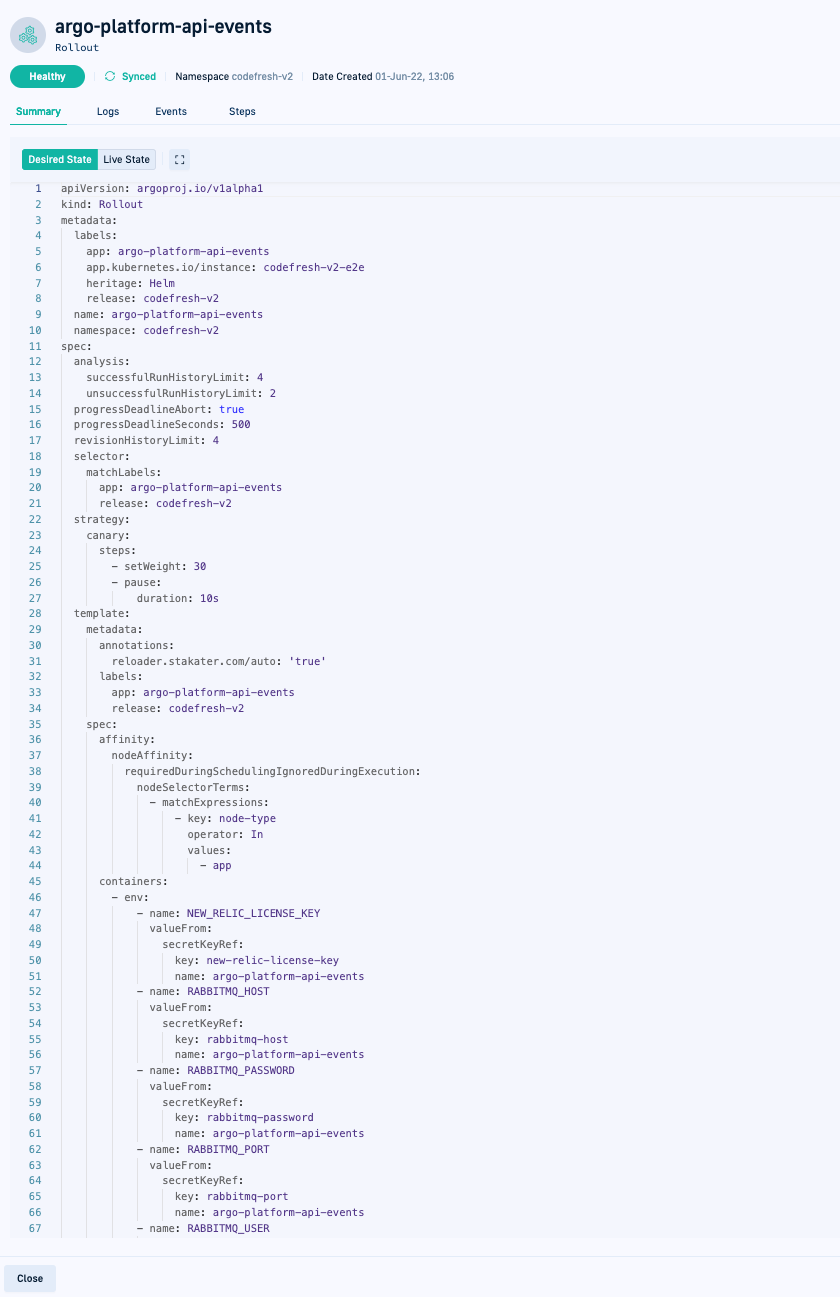
In either Tree or List views, double-click an application resource to see its manifests. The manifests are displayed in the Summary tab.
NOTE
Based on the selected resource type, you can also view logs, and events. Endpoints for example show only manifests, while pods show manifests, logs, and events.
To view information for the application resource, select the application node in Tree View. See Application information.
Here’s what you can see and do in the Summary tab:
TIP
Press Ctrl/Command F to search for strings in the manifest.
- Desired and Live states of the resource manifest:
- Managed resources, stored in Git repositories and using Git as the single source of truth, show both the Desired (Git) and the Live (cluster) states.
If there are discrepancies between them, the Diff view is displayed, highlighting the differences in both versions for comparison. - Resources that are not stored in Git but live in the cluster, show only the Live state.
- Managed resources, stored in Git repositories and using Git as the single source of truth, show both the Desired (Git) and the Live (cluster) states.
- Share resource details: Copy the URL and send to others in your organization to share the resource details for collaborative review and analysis. Pasting the URL in a browser opens to the same view of the resource.
- Hide Managed Fields: In the Live state version of the manifest, you can hide managed-field information from the manifest. Managed-fields show information on which field manager manages the field, after Kubernetes introduced
Server Side Apply. For more information, see Field Management.
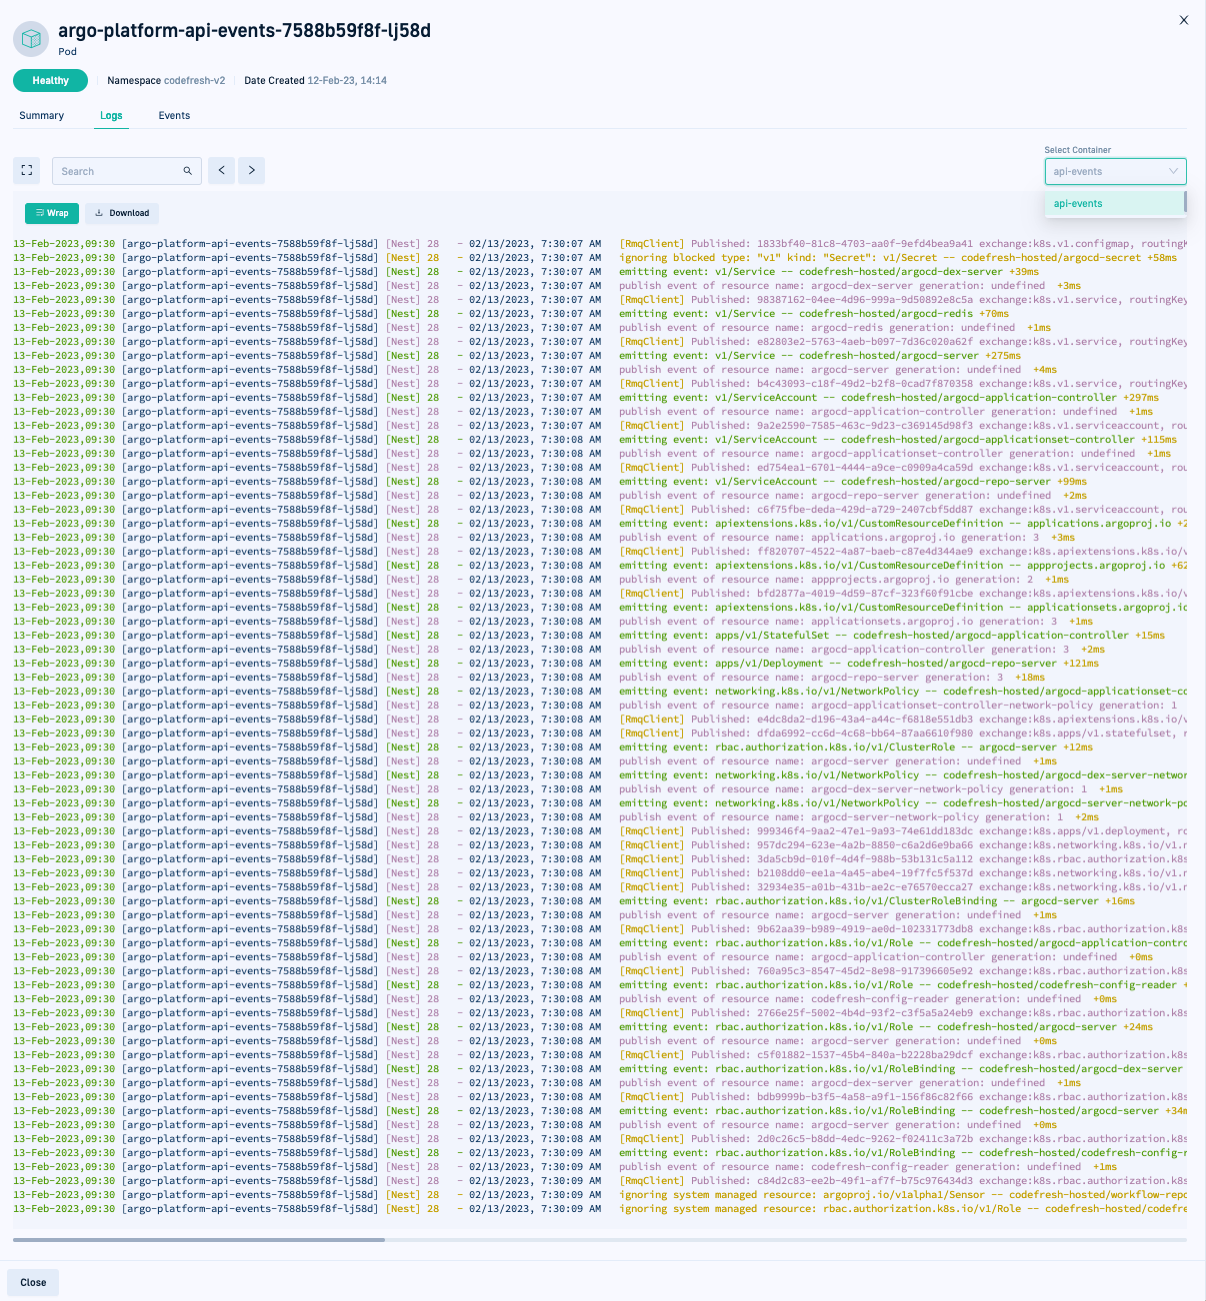
Logs for application resources
In either Tree or List views, double-click an application resource to see its logs. Logs are available only for resource types such as pods.
NOTE
A disabled Logs tab indicates that you have not been assigned the permission to view logs for pod resource types. Contact your administrator for help.
- Search: Free-text search for any string in the log, using the next and previous buttons to navigate between the results, or Enter for sequential navigation.
- Wrap: Enable/disable line wrapping
- Download: Download the complete log into a text file for offline viewing and analysis.
Events for application resources
In either Tree or List views, double-click an application resource to see events in the Events tab.
NOTE
If your runtime is lower than the version required to view events, you are notified to upgrade to the required version.
The Events tab displays both successful and failed events from Argo CD, starting with the most recent event. Argo CD displays events as they occur for an application resource, and retains event information for a duration of 30 minutes. Historical events older than this duration are removed, and the Events tab can be empty if there are no ongoing events.
Monitoring deployments for selected Argo CD application
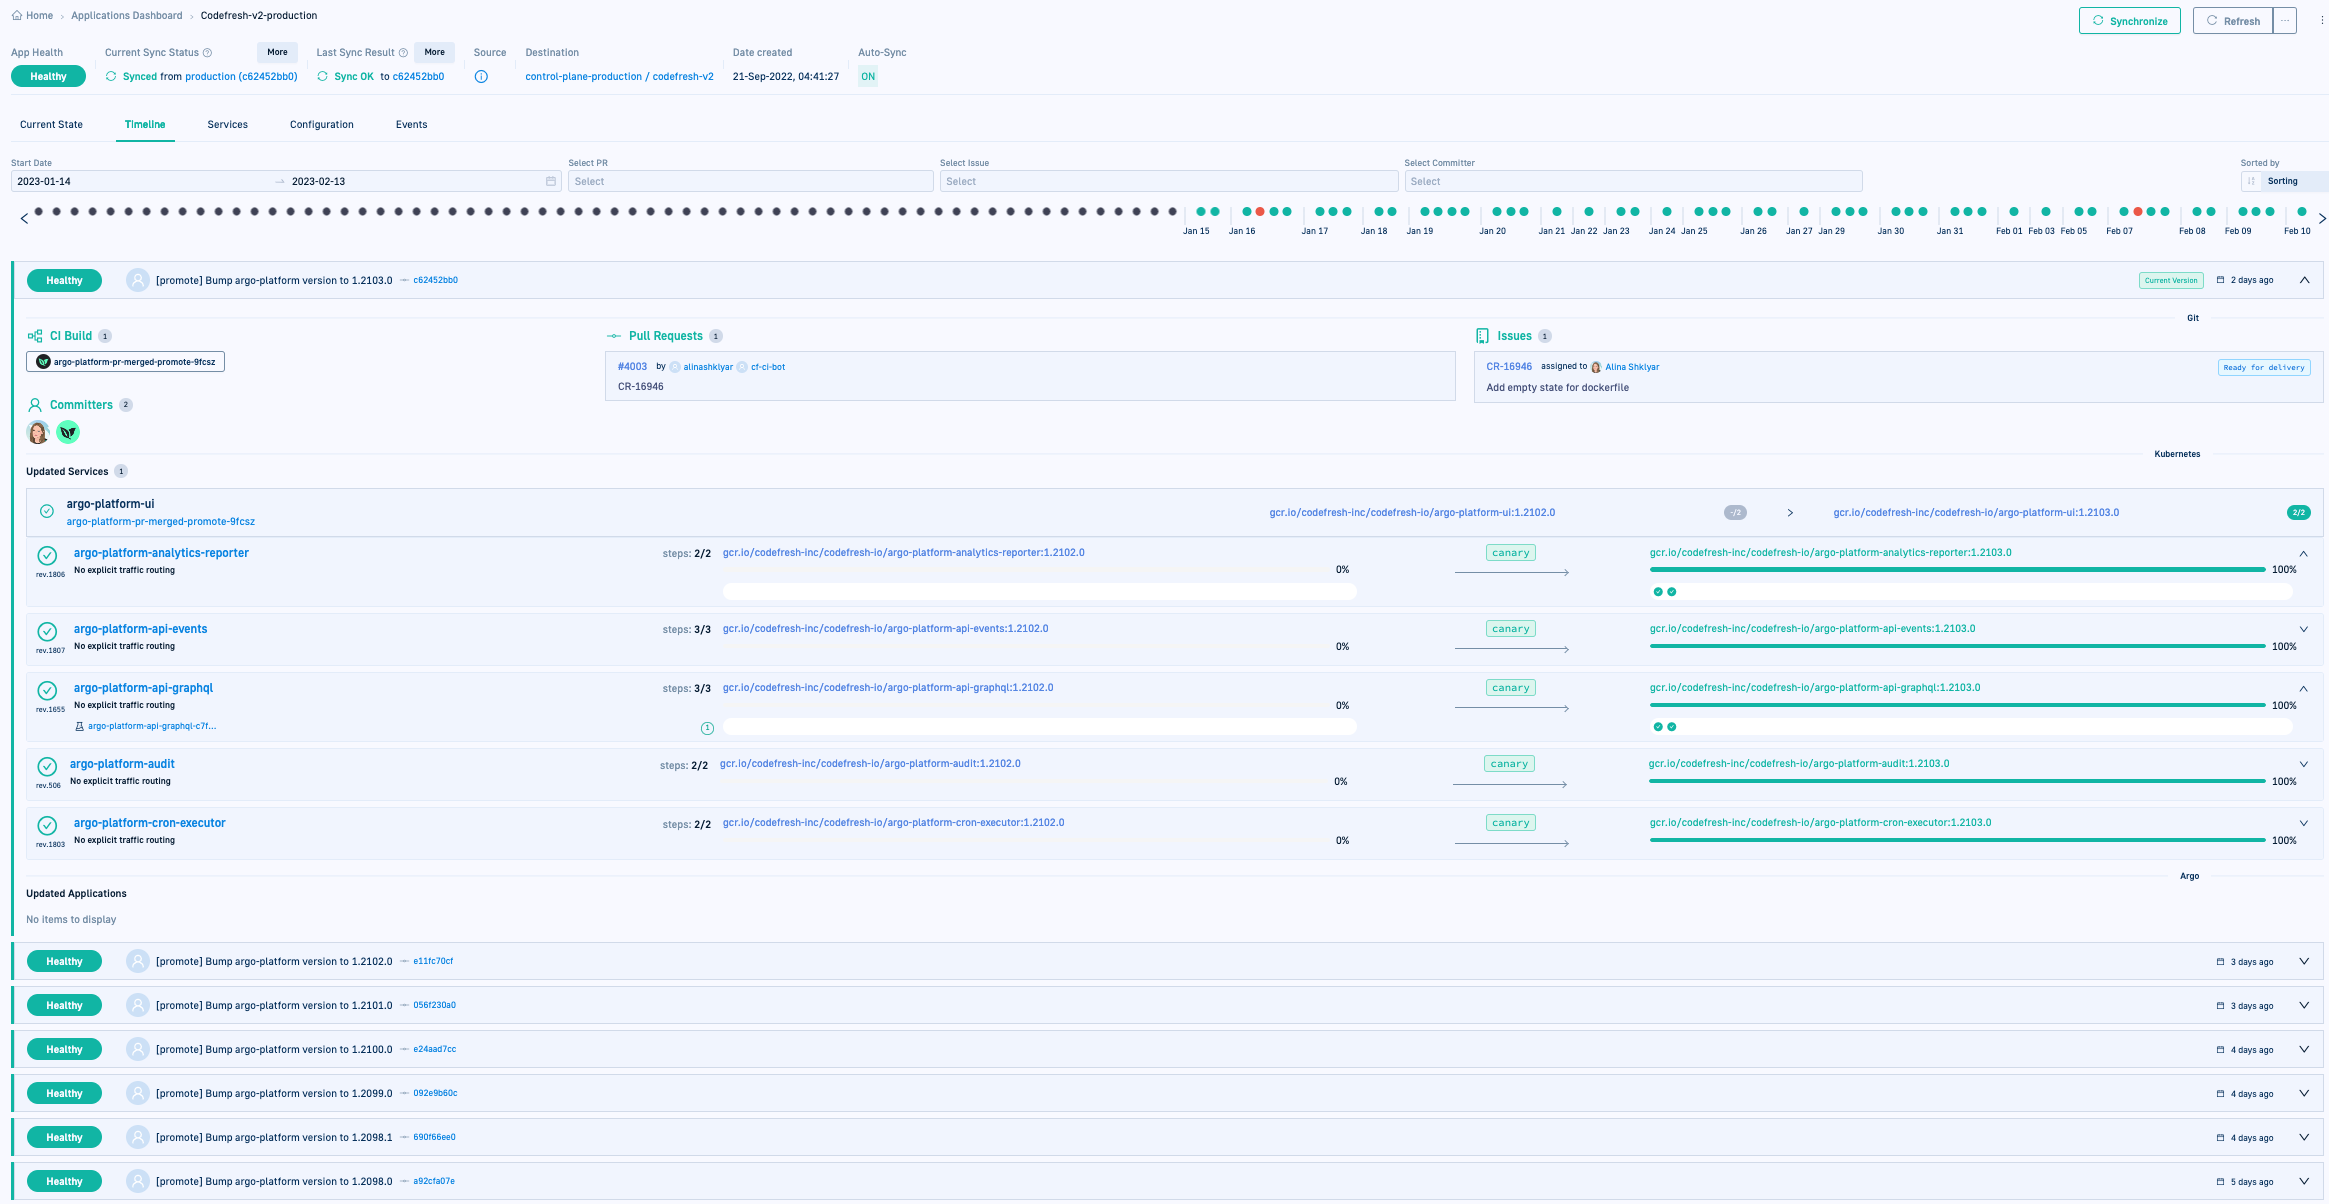
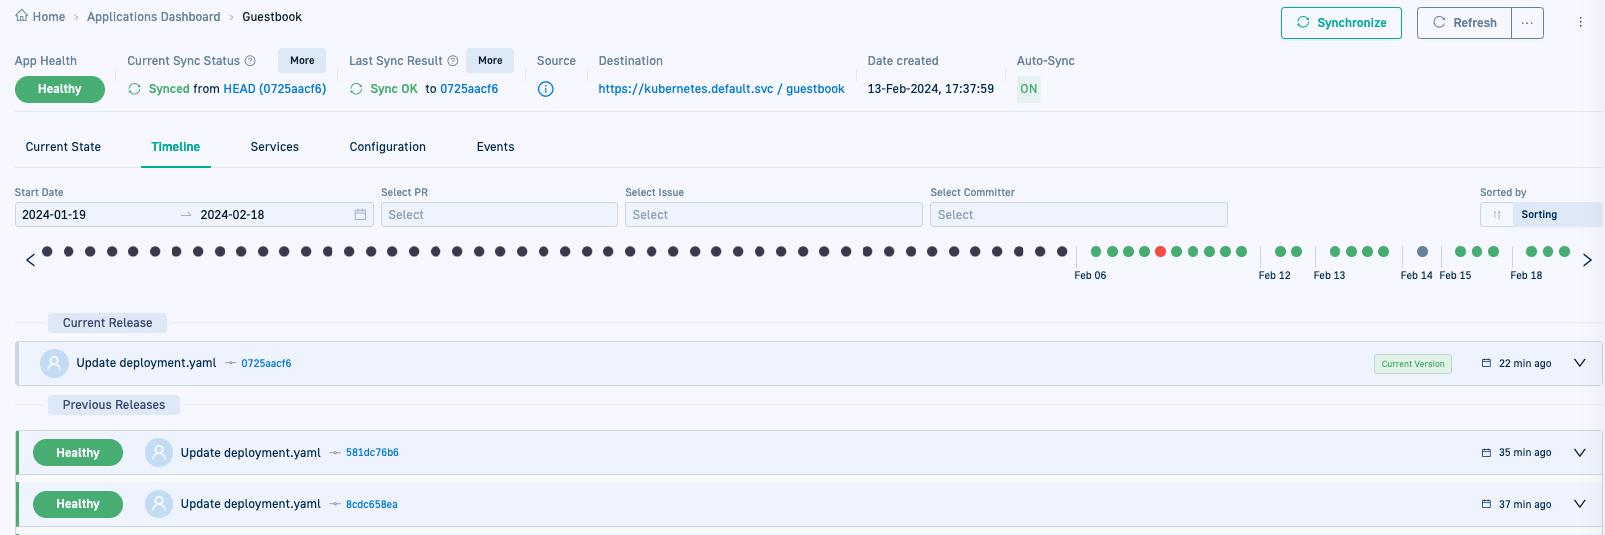
Monitor ongoing and historical deployments for the selected application. The Timeline tab displays all the deployments for the selected application, with the Current Release deployment record at the top, followed by the list of Previous Releases.
Deployment Chart
The Deployment Chart below the Application Header displays the day-to-day deployments for the selected time period.
To view information on historical deployments, mouse over the dot on the deployment chart.
Current Release
- The Current Release deployment record is only displayed in the first page of deployments.
- The deployment record for the Current Release is tagged as Current Version.
- The health status of the Current Release is the application’s health status as displayed in the Application Header.
- The release revision is identical to the sync revision displayed in Last Sync Result. If the release and sync revisions are not identical, which can be the case for different reasons, the Current Release displays a loading status instead of the release revision.
TIP
If the Current Release deployment record is not displayed, it could be because filters are applied.
You can:
See also Troubleshoot Argo CD applications.
How to monitor deployments
- If required, set filters to narrow the number of deployments for the selected application.
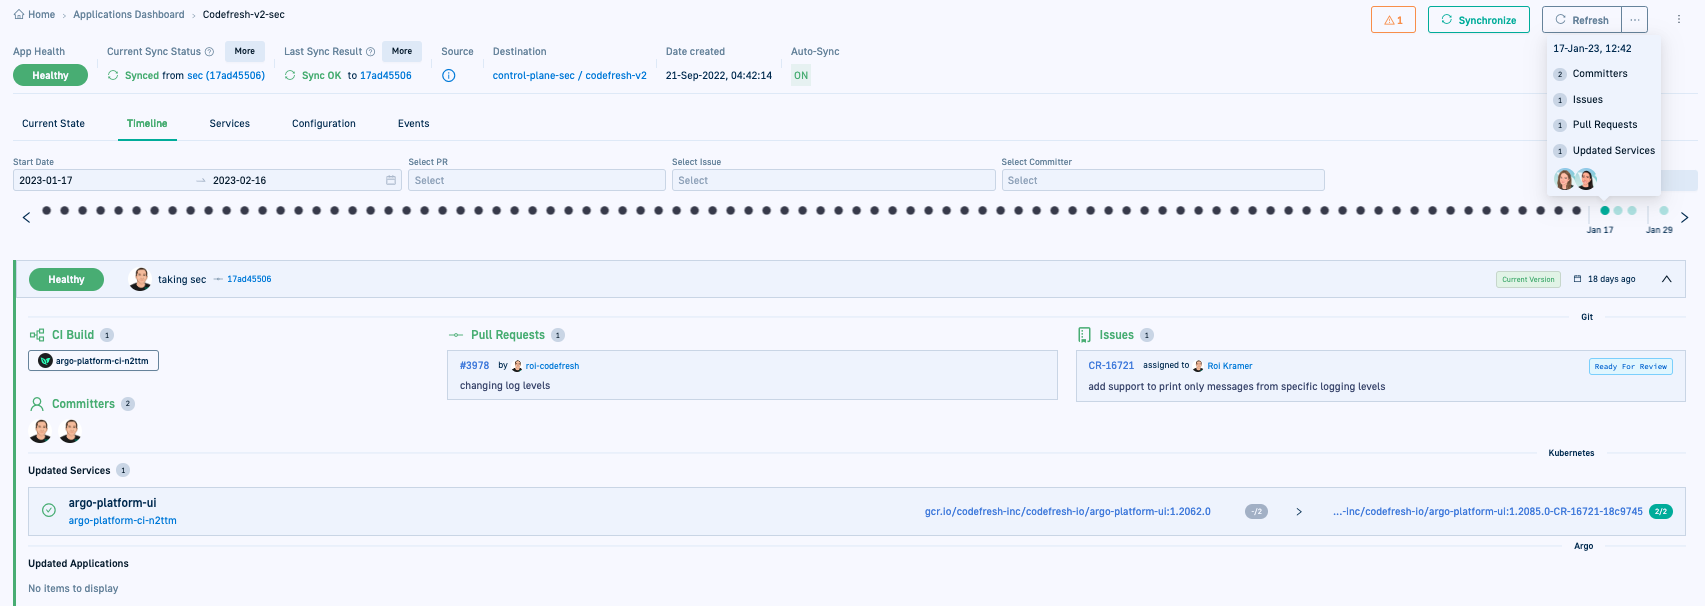
- To view GitOps details for a deployment, in the deployment chart mouse over the dot that represents the deployment.
- To view additional details, expand the record for that deployment.
Monitor CI details by deployment
Each deployment record displays the complete CI history for that deployment.
- The CI Builds shows the Argo Workflow run in the deployment. Click the build name to see the Argo Workflow in a new browser window.
- The Pull Request (PRs) used for the commit.
- The Jira Issues the PR aims to resolve or has resolved, with the current status.
- The Committer who made the changes.
Monitor rollouts by deployment
A rollout is initiated when there is an Argo CD sync due to a change in the desired state.
Visualize ongoing and completed rollouts by deployments in Updated Services.
Clicking the image name displays the image in the Images dashboard.
NOTE
To view and manage a rollout, you must have an Argorolloutresource defined for your application, and install Argo Rollouts in the cluster.
For detailed information on Argo Rollouts, see Argo Rollouts documentation.
Rollout progress
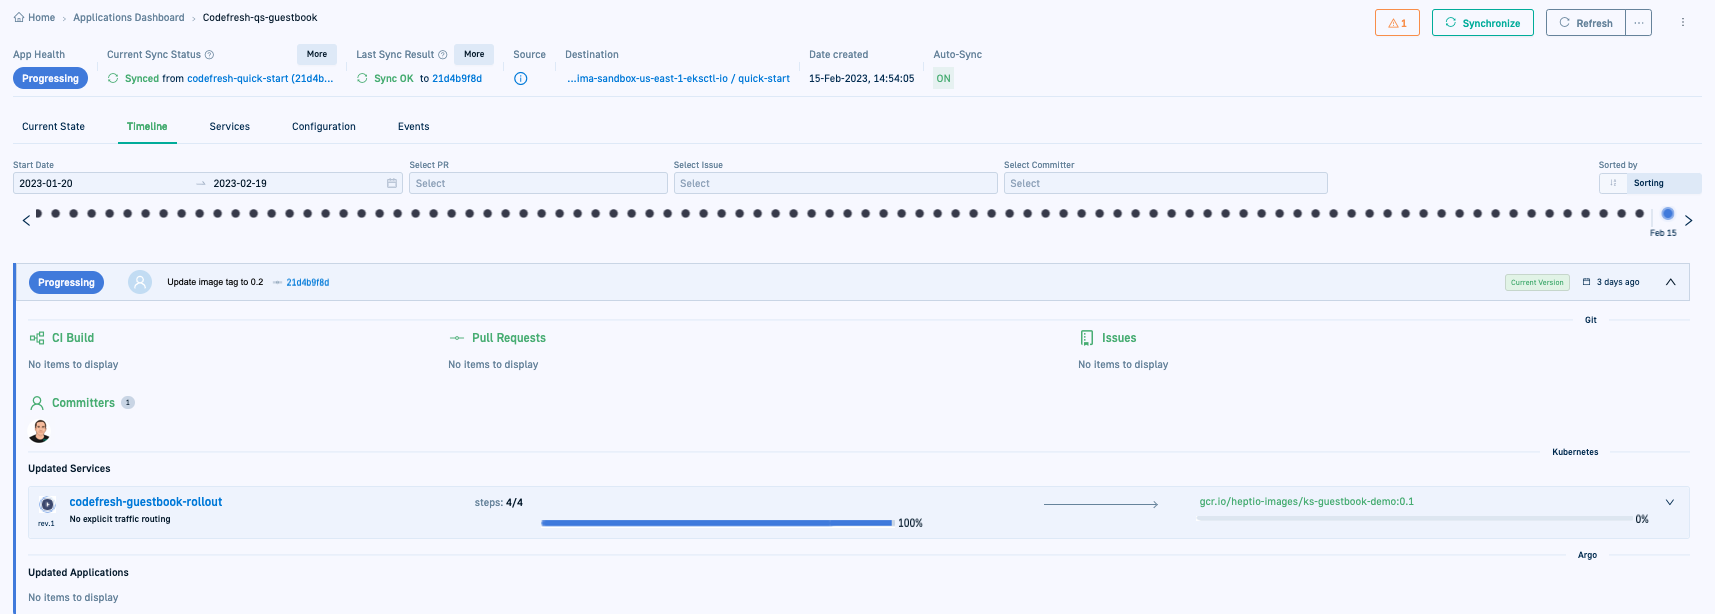
For an ongoing rollout, the rollout bar displays the progress of the rollout. You can also visualize the steps in the rollout, and control the rollout using the options in the Rollout Player.
Here is an example of an ongoing rollout for a canary deployment in Updated Services. The rollout comprising four steps has not started, and no traffic has not been routed as yet to the new version of the application.
Based on the current state of the rollout, you can pause and resume an ongoing rollout.
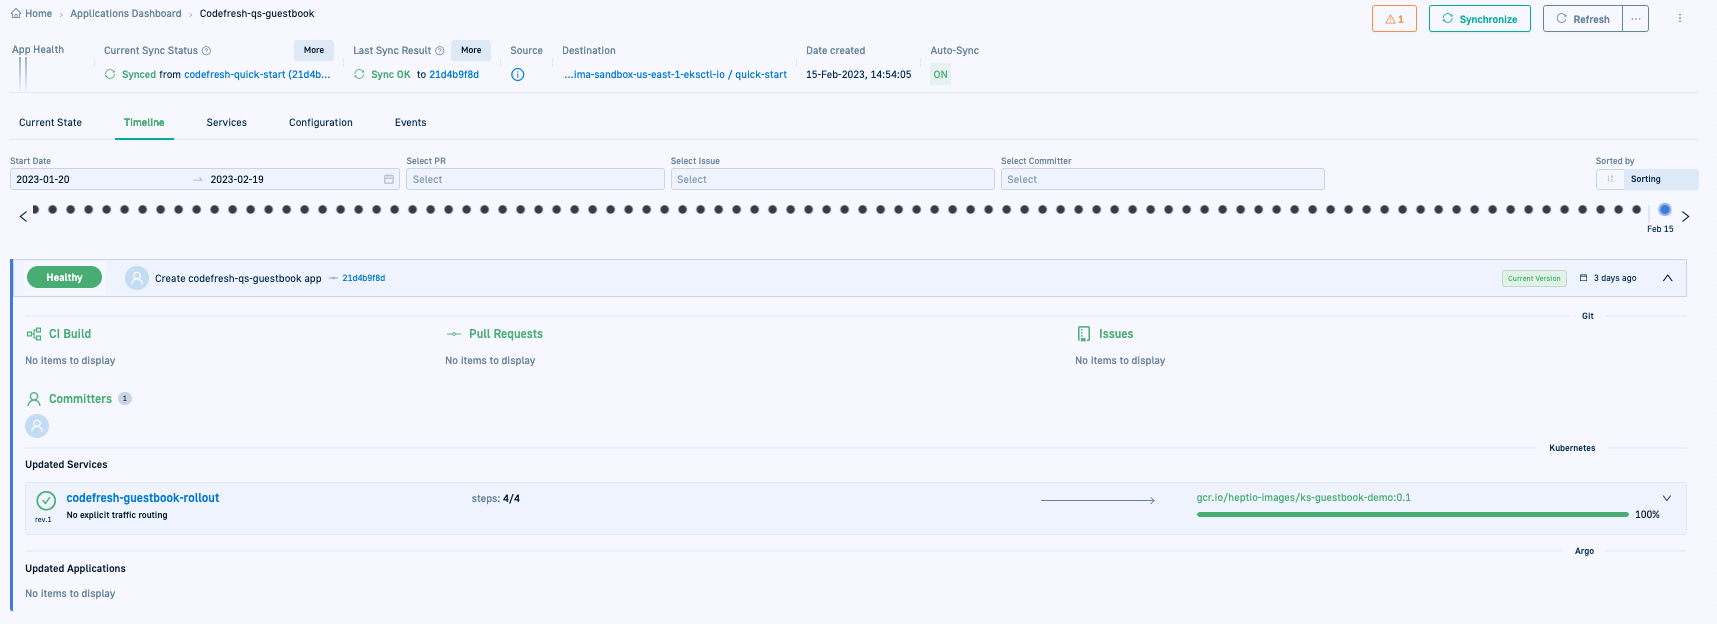
Here is an example of the rollout for the same deployment on completion. All traffic has been routed to the new version.
Manage ongoing rollout
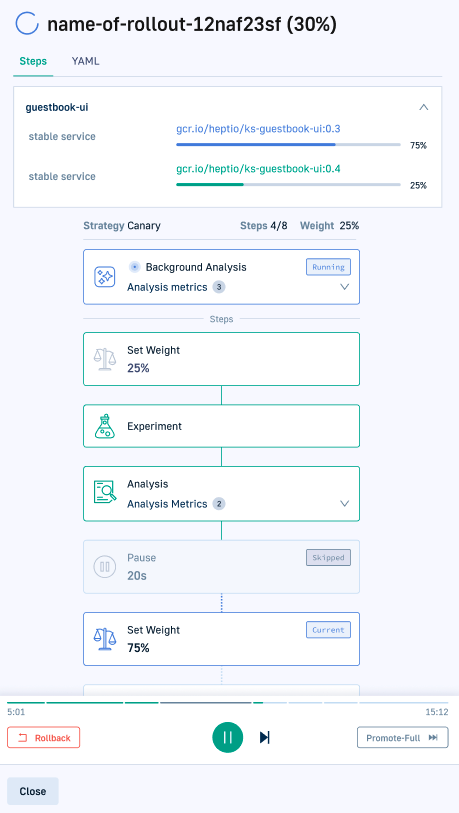
Click the rollout name to visualize its steps. Manually manage the rollout through the controls in the Rollout Player. Here you can see that two out of four steps have been completed, 25% of the traffic has been routed, and the rollout has been paused for the defined length of time.
The table lists the controls in the Rollout Player to manage an ongoing rollout.
| Rollback player icon | Option | Description |
|---|---|---|
| Rollback | Rollback rollout to the selec. | |
| Resume | Resume a step that has been paused indefinitely. | |
| Skip step | Skip execution of current step. Such steps are marked as Skipped in the rollout visualization. | |
| Promote full rollout | Skip remaining pause, traffic routing, and analysis steps, and deploy the current release. |
View analysis run
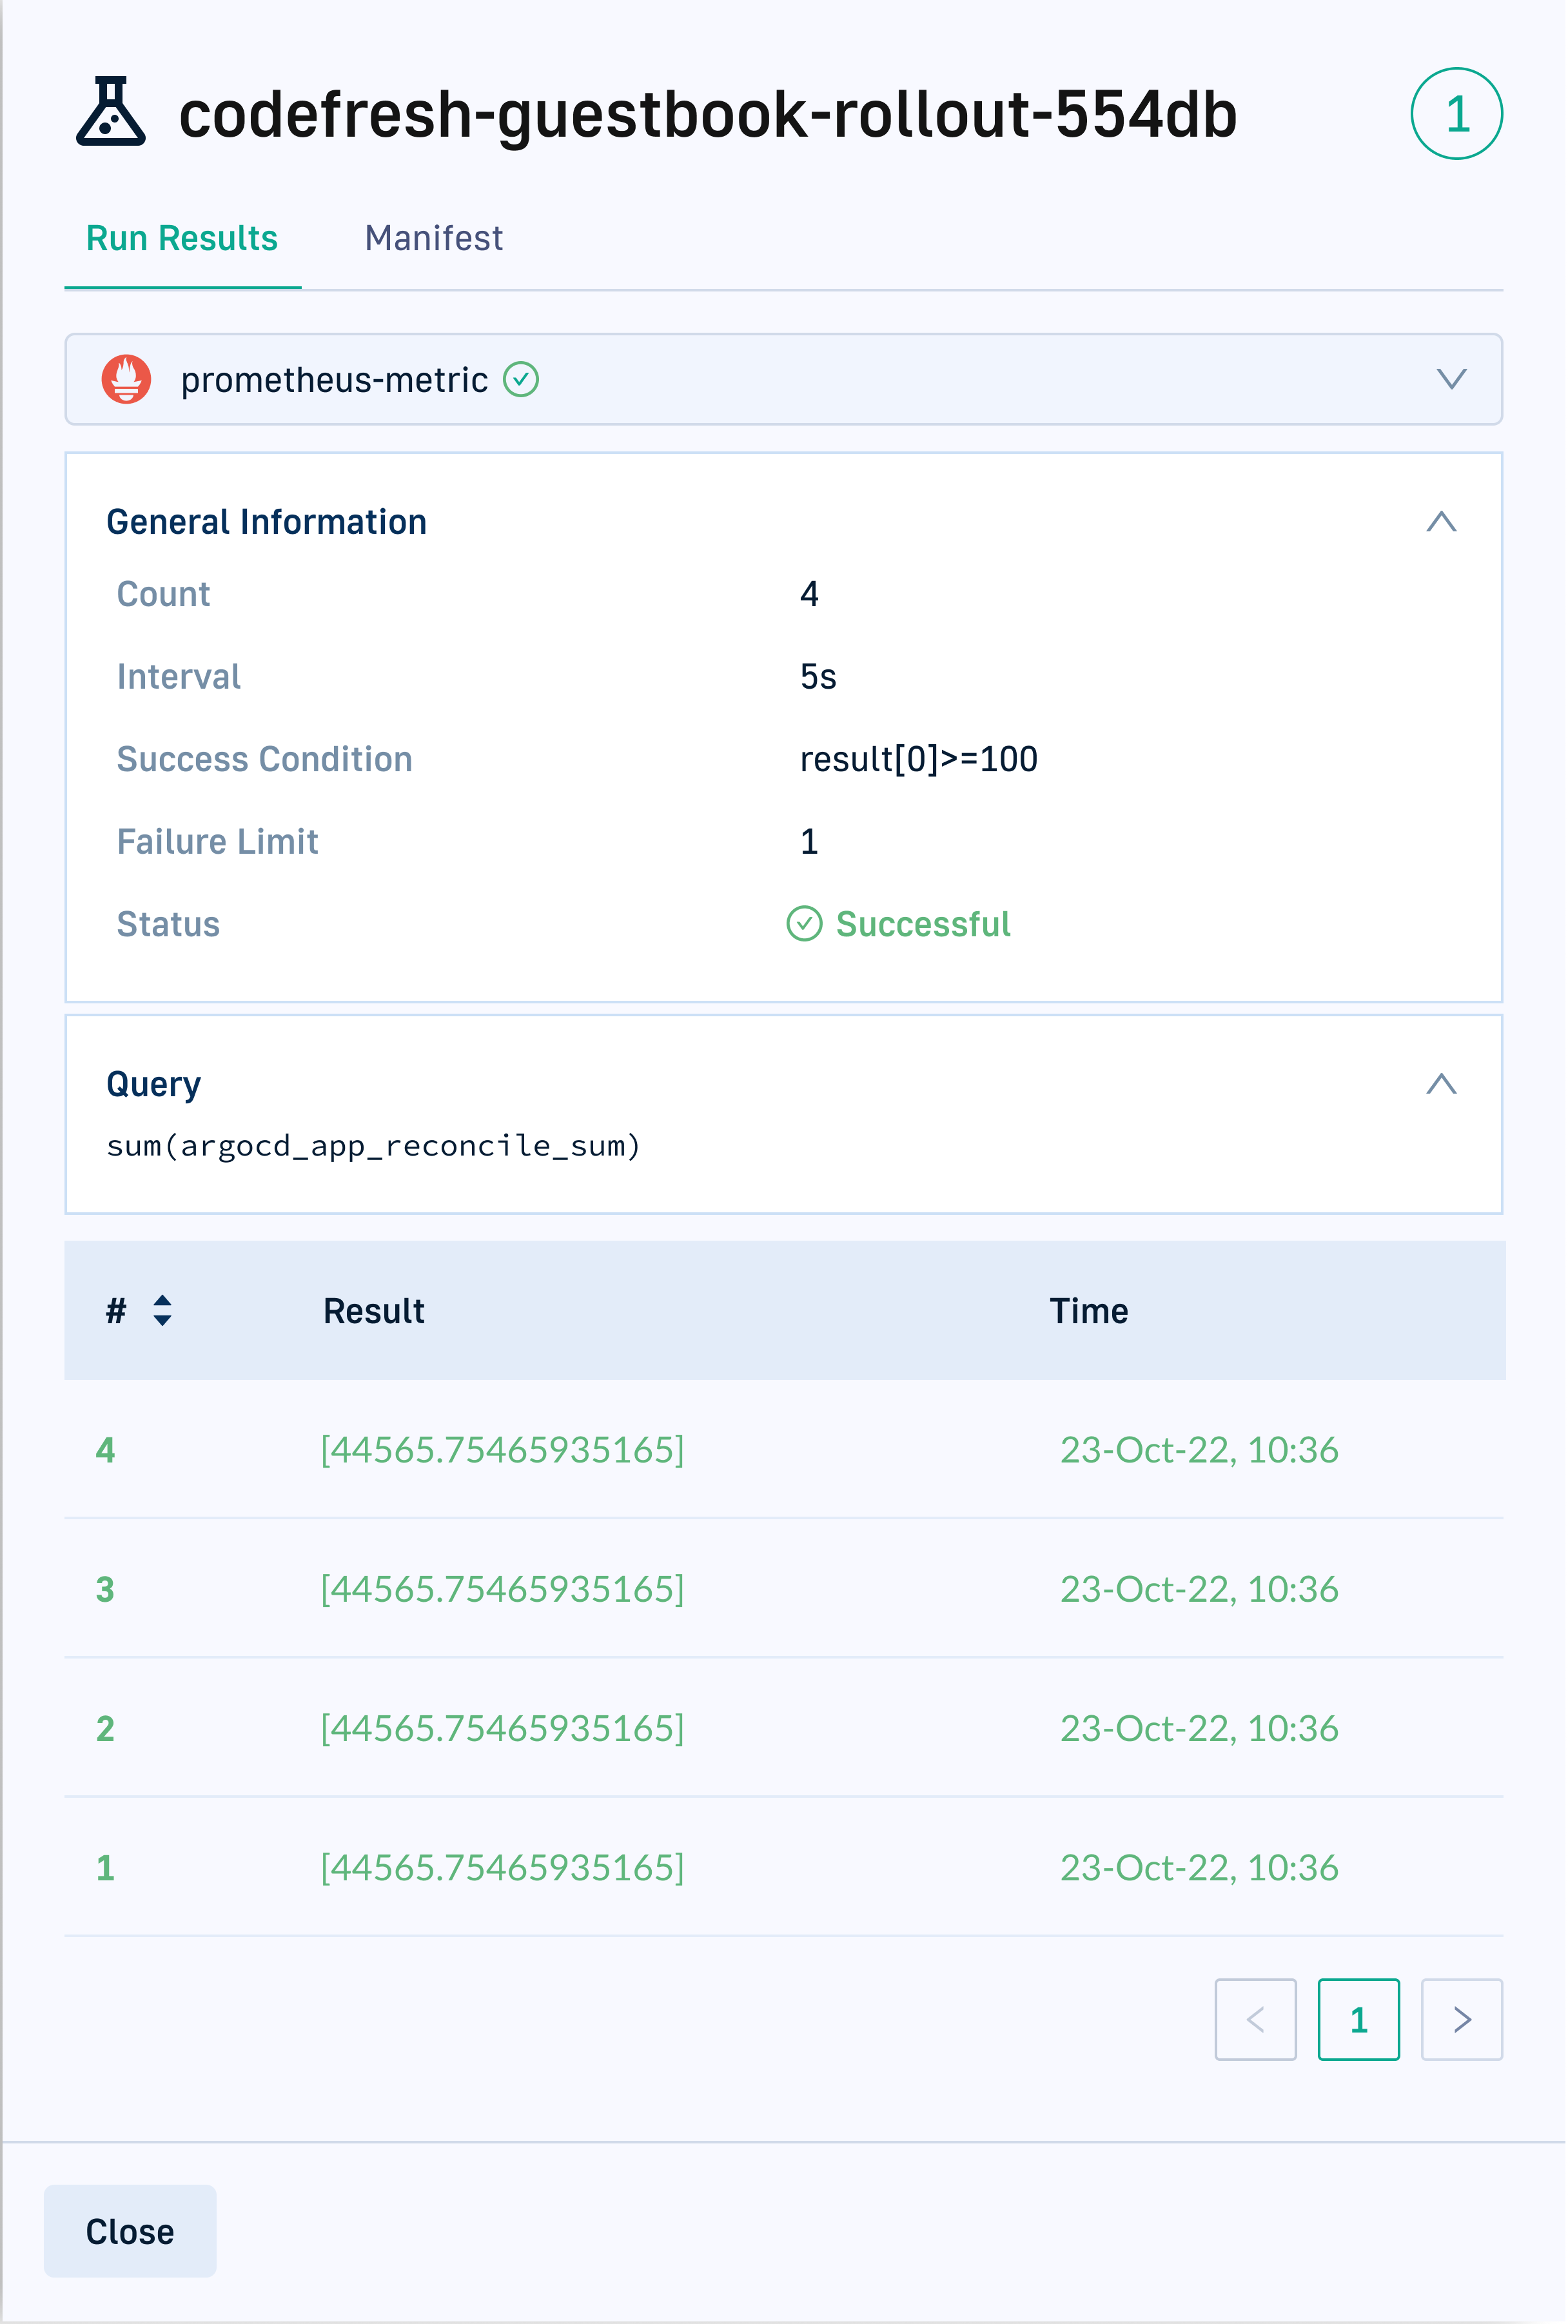
If you have defined an AnalysisTemplate for the rollout, you can check the run results and the manifest. The result of an AnalysisRun determines if the rollout is completed, paused, or aborted. For detailed information, see the Analysis section in Argo Rollouts.
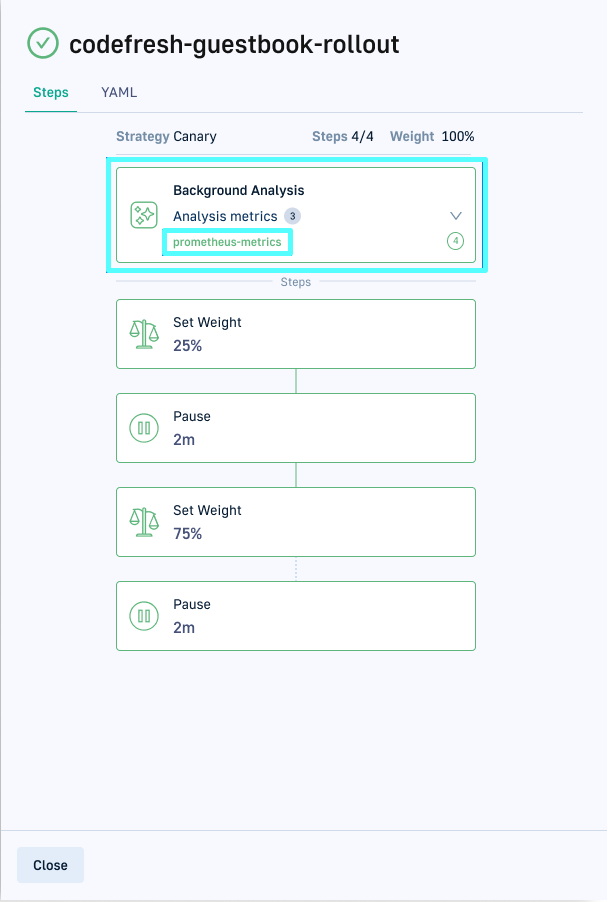
If you are running Background Analysis for example, the first step shows the list of analysis metrics.
Click the metric link in the step.
Monitoring services for selected Argo CD application
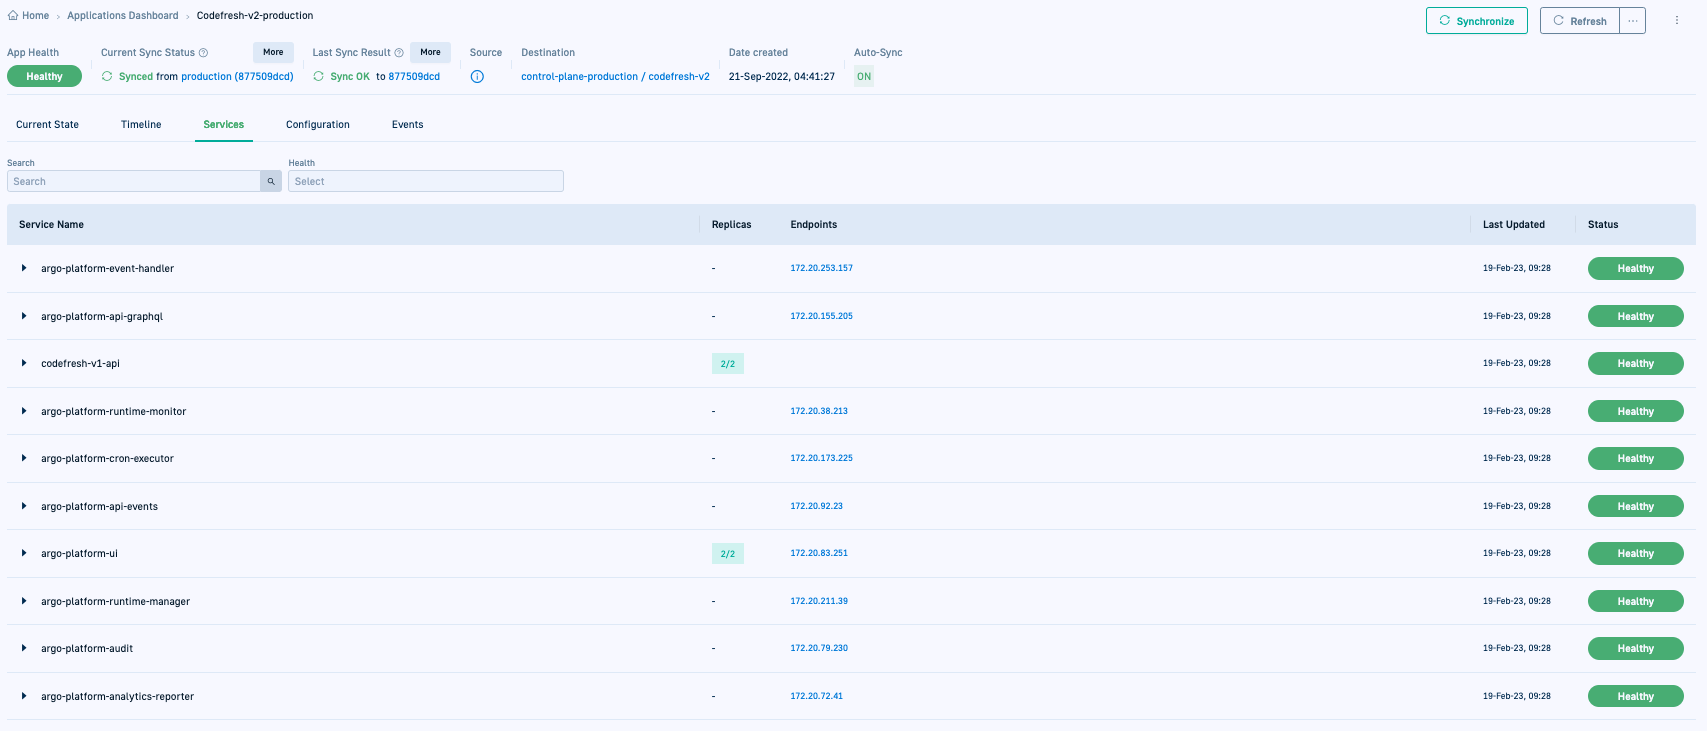
The Services tab shows the K8s services for each deployment of the application. Each service shows the number of replicas, the endpoint IP, the labels that reference the application, and the health status.
For more information, see the official documentation on Services.
Related articles
Creating GitOps applications
Managing GitOps applications
Troubleshooting GitOps applications
GitOps Environments dashboard
GitOps Products dashboard
Home Dashboard
DORA metrics
